
Stand Structure and Growth Drivers of Aboveground Biomass and Carbon in Acacia Plantations
-
Horn Sarun


Faculty of Agricultural Economics and Rural Development, Royal University of Agriculture, Cambodia
Hin Lyhour
Faculty of Agricultural Biosystems Engineering, Royal University of Agriculture, Cambodia
Nhean SopheaFaculty of Agricultural Economics and Rural Development, Royal University of Agriculture, Cambodia
Thav SopheakFaculty of Forestry Science, Royal University of Agriculture, Cambodia
In SokraMetabolic Engineering Research Unit, School of Biotechnology, Suranaree University of Technology, 111 University Avenue, Suranaree, Muang, Nakhon Ratchasima, 30000, Thailand
| Received 14 Jan, 2026 |
Accepted 19 Jun, 2026 |
Published 30 Jun, 2026 |
Background and Objective: Understanding growth dynamics and carbon storage in plantation forests is essential for assessing their role in climate change mitigation. The main objective of this study is to quantify the aboveground biomass and carbon stocks in Acacia plantations and to identify the key stand structure and growth factors that influence biomass accumulation and carbon sequestration. Materials and Methods: This study examined tree growth, stand structure, and biomass allocation in Acacia plantations (11-15 years old) in Cambodia using descriptive statistics, ANOVA, correlation, and Principal Component Analysis (PCA). Results: The stands were relatively even-aged, with DBH averaging 19.3 cm and height averaging 18.8 m, but exhibited substantial variability in basal area, volume, and biomass. ANOVA revealed significant differences among age groups for height, bole height, and stand volume (p<0.01), while DBH, aboveground biomass (AGB), and carbon stock showed no significant variation. Correlation analysis highlighted DBH as the strongest predictor of biomass and carbon (r = 0.98), followed by tree height (r = 0.76). PCA further indicated that the first two components explained nearly 90% of the variance, with PC1 representing tree size and biomass (DBH, height, AGB, carbon) and PC2 representing stand structure (basal area, volume). Nonlinear modeling confirmed that the logarithmic height-diameter relationship provided the best fit (R2 = 0.75, lowest AIC and RMSE). Conclusion: Overall, the findings demonstrate that carbon storage in Acacia plantations is strongly controlled by DBH and a few dominant trees, while stand density influences structural development. These insights highlight the importance of managing tree size and stand density to optimize biomass production and carbon sequestration in Acacia plantations of Cambodia.
| Copyright © 2026 Sarun et al. This is an open-access article distributed under the Creative Commons Attribution License, which permits unrestricted use, distribution, and reproduction in any medium, provided the original work is properly cited. |
INTRODUCTION
Forests play a critical role in mitigating climate change by sequestering atmospheric carbon dioxide and storing it in biomass and soils. Globally, forests contain approximately 80% of terrestrial aboveground carbon and about 40% of belowground carbon1. However, deforestation and forest degradation continue to release significant amounts of carbon into the atmosphere, particularly in tropical regions2. As a result, afforestation and reforestation initiatives have gained increasing importance as strategies to restore carbon sinks and enhance global climate resilience. Plantation forests are rapidly expanding across the tropics, providing timber, fuelwood, pulp, and other ecosystem services. Beyond their commercial roles, plantations are increasingly recognized for their contribution to carbon sequestration and climate change mitigation3. Among plantation species, fast-growing trees are particularly valuable due to their capacity to accumulate biomass rapidly on degraded lands, thereby improving both productivity and environmental services4,5. Within Southeast Asia, Acacia species-particularly Acacia mangium and hybrids with A. auriculiformis-have become dominant due to their rapid growth, adaptability, and nitrogen-fixing ability6. These traits enable them to thrive on marginal soils, enhance soil fertility, and produce valuable timber and pulp7. The expansion of Acacia plantations in Vietnam, Indonesia, Malaysia, and increasingly in Cambodia reflects both economic and ecological motivations. Several studies have demonstrated that Acacia plantations significantly contribute to carbon sequestration. For instance, Luyssaert et al.8 reported that A. mangium plantations in Malaysia stored substantial amounts of carbon in both aboveground biomass and soil. Similarly, Luyssaert et al.8 observed progressive increases in carbon storage with stand age in Vietnamese A. mangium plantations. These findings emphasize the importance of including Acacia systems in national climate change mitigation strategies. Accurate estimation of biomass and carbon storage requires robust allometric models that relate easily measurable variables, such as diameter at breast height (DBH) and tree height-to biomass9. DBH is consistently the strongest predictor of aboveground biomass, while tree height often adds explanatory power, especially in heterogeneous stands10. The DBH-height relationship is typically nonlinear, following logarithmic, power, or asymptotic forms Huang et al.11. In addition to allometric equations, biomass expansion factor (BEF) models have been developed to improve estimation accuracy, particularly in plantation systems12. Recent research in Vietnam has proposed BEF models for Acacia hybrids that incorporate DBH, height, and age, achieving strong prediction accuracy13. Such models reduce uncertainty in biomass estimates, an essential step in developing reliable carbon accounting frameworks. Stand structure, including basal area, stand density, and volume-strongly influences tree growth dynamics and carbon storage. Studies have shown that basal area correlates with stand volume but can negatively affect individual tree height due to density-driven competition14. Therefore, understanding structural attributes is essential for assessing forest productivity and carbon dynamics at both tree and stand levels. Age is another key determinant of growth and carbon accumulation, but within a narrow age range (e.g., 11-15 years), differences in DBH and biomass may be minimal, whereas height and bole height may still vary significantly15. Although regional allometric equations exist, their transferability across sites is often limited due to differences in climate, soil, and management practices9. Hence, site-specific data collection and modeling are essential to improve the accuracy of biomass and carbon estimation in Cambodian Acacia plantations. Stand volume per hectare and basal area are crucial indicators of productivity, but their relationships with biomass and carbon vary depending on stand density. In dense plantations, basal area may increase total volume but suppress individual height and bole height14. These trade-offs highlight the complex role of stand structure in biomass allocation. Given Cambodia’s vulnerability to climate change and reliance on forest resources, quantifying the carbon potential of Acacia plantations has strong policy relevance. Such data can support Cambodia’s REDD+ initiatives and climate mitigation commitments under the Paris Agreement16. Despite the growing importance of Acacia plantations, little is known about their growth dynamics, biomass accumulation, and carbon storage in Cambodia. Most existing studies originate from Vietnam, Malaysia, or Indonesia, leaving a gap in empirical evidence for Cambodian sites.
This study addresses these gaps by analyzing growth, stand structure, and carbon storage in Acacia mangium plantations aged 11-15 years in Cambodia. Using descriptive statistics, ANOVA, correlation analysis, Principal Component Analysis (PCA), and nonlinear modeling, we aim to identify the structural drivers of biomass and carbon, evaluate the best allometric models, and provide site-specific insights to inform sustainable plantation management.
MATERIALS AND METHODS
Study area: The study was conducted in Acacia mangium plantations located in Cambodia, within a tropical monsoon climate characterized by distinct wet and dry seasons. The sites were established on degraded lands to promote reforestation and timber production. Mean annual rainfall in the region ranges between 1,200 and 1,800 mm, with mean annual temperatures of 26-28°C. The soils are predominantly sandy loams and clay loams, typical of lowland plantation areas. The sampled stands ranged from 11 to 15 years old, representing the main commercial rotation age for Acacia in Southeast Asia7. Field data collection was carried out over one month in May 2024, during which a total of 10 sample plots were established and measured.
Sampling design and data collection: A total of 500 sample trees were randomly selected across five age groups (11, 12, 13, 14, and 15 years). Within each group, plots were established following a randomized sampling design to ensure representative coverage of stand variability. For each tree, the following growth variables were measured: diameter at breast height (DBH, cm), total tree height (m), bole height (m), basal area (m2/ha), stand volume (m3/ha), aboveground biomass (AGB, kg), and carbon stock (kg). DBH was measured at 1.3 m above ground level using a diameter tape, while total height and bole height were determined using a clinometer. Stand volume per hectare was estimated from DBH, height, and stand density using standard volume equations10.
Biomass and carbon estimation: Aboveground biomass was estimated using species-specific allometric models, with DBH and height as predictor variables. For Acacia mangium, biomass was calculated using equations recommended for tropical plantations6,9. Carbon stock was derived from AGB by applying a default carbon conversion factor of 0.4717, which is widely used in tropical plantation studies.
Descriptive statistics: Descriptive statistics-including mean, standard deviation, coefficient of variation (CV), skewness, kurtosis, and quartile distribution-were calculated for all measured variables to characterize central tendency and variability. The CV values were used to assess relative variability among variables, while skewness and kurtosis were used to interpret distribution shapes18.
Analysis of Variance (ANOVA): One-Way ANOVA was performed to test for significant differences among the five age groups for each growth variable. Age was considered a fixed factor, while growth and biomass variables were dependent factors. Statistical significance was evaluated at p<0.05. Post-hoc comparisons were made using Tukey’s Honest Significant Difference (HSD) test19.
Correlation analysis: Pearson’s correlation coefficients were computed to assess linear relationships among growth and biomass variables. Correlation strength was classified as strong (r≥0.7), moderate (0.3≤r<0.7), or weak (r<0.3) following Cohen20. This analysis identified the most influential predictors of aboveground biomass and carbon stock.
Nonlinear modeling: Nonlinear regression models were developed to describe the relationship between DBH and height. Four candidate models-logarithmic, power, asymptotic, and Weibull-were tested. Model performance was evaluated based on the Akaike Information Criterion (AIC), coefficient of determination (R2), and Root Mean Square Error (RMSE). The best-fitting model was selected based on the lowest AIC and RMSE values and the highest R2 of Burnham and Anderson21.
Principal Component Analysis (PCA): Principal Component Analysis (PCA) was performed to reduce data dimensionality and identify key structural gradients. Standardized variables (DBH, height, bole height, basal area, volume, AGB, and carbon) were used in the analysis. Components with eigenvalues greater than 1 were retained21. Variable loadings were used to interpret the dominant contributors to each principal component.
Software: All statistical analyses were conducted using Python libraries including pandas, scikit-learn, and statsmodels. Data visualization included boxplots, scatterplots with nonlinear fits, and PCA biplots.
RESULTS
Descriptive statistics of stand structure variables: The stand is relatively even-aged, averaging 13 years, with low variability in age and tree height. Heights are fairly consistent (mean ≈18.8 m), and the negative skewness indicates that most trees are tall, suggesting strong competition-driven vertical growth, as shown in Table 1. This uniformity in age and height reflects a managed plantation where trees developed under similar environmental conditions. In contrast, DBH, basal area, and volume exhibit greater variability, with positive skewness indicating that many trees remain small to medium-sized while a few individuals have grown substantially larger. These dominant trees disproportionately influence stand structure and productivity, as reflected in basal area and volume distributions. Aboveground biomass (AGB) and carbon stock further highlight this structural inequality, with very high coefficients of variation (>70%) and strong positive skewness. While most trees store relatively low amounts of carbon, a small number of large individuals contribute disproportionately to total biomass and carbon sequestration. Overall, the forest exhibits a uniform age structure but uneven growth patterns, suggesting that ecosystem functions such as carbon storage depend heavily on dominant trees.
Comparison of growth attributes across age groups (ANOVA): The ANOVA results revealed that tree height, bole height, and stand volume differed significantly among the five age groups, indicating that these structural attributes were strongly influenced by stand conditions and possible management effects. Specifically, tree height (F = 11.97, p<0.001) and bole height (F = 3.60, p = 0.0066) varied substantially, suggesting that vertical growth is more responsive to site and age variations than horizontal expansion.
| Table 1: | Descriptive statistics of stand and tree attributes in 11-15-year-old Acacia mangium plantations (n = 500) | |||
| Variable | Mean | Std | Min | Max | CV (%) | Skew | Kurt |
| Age (years) | 13.1 | 1.458 | 11 | 15 | 11.15 | -0.11 | -1.38 |
| DBH (cm) | 19.3 | 5.898 | 8 | 38 | 30.55 | 0.87 | 0.72 |
| Basal area (m2/ha) | 0.7 | 0.284 | 0.3 | 1.5 | 39.25 | 1.19 | 0.91 |
| Volume (m3/ha) | 6.3 | 2.273 | 2.7 | 16.5 | 35.85 | 1.35 | 2.45 |
| Height (m) | 18.8 | 2.663 | 11 | 26 | 14.2 | -0.75 | 0.62 |
| Bole height (m) | 13.1 | 3.704 | 8 | 19 | 28.33 | -1.64 | 2.15 |
| AGB (kg/tree) | 184.1 | 133.39 | 19.3 | 774.8 | 72.47 | 1.73 | 3.02 |
| Carbon (kg/tree) | 86.5 | 62.69 | 9.1 | 364.1 | 72.47 | 1.73 | 3.02 |
| Min: Minimum, Max: Maximum, CV: Coefficient of variation; AGB: Aboveground biomass, Skew: Skewness and Kurt = Kurtosis | |||||||
| Table 2: | One-Way ANOVA results for tree and stand attributes across five age groups (11-15 years) in Acacia mangium plantations (n = 500) | |||
| Variable | F | p-value |
| Height (cm) | 11.9713 | 2.71×10⁻⁹ |
| Volume (m3/ha) | 4.361 | 0.00178 |
| Bole height (m) | 3.6019 | 0.00659 |
| Carbon (kg) | 1.3813 | 0.2392 |
| AGB (kg) | 1.379 | 0.24 |
| DBH (cm) | 1.0796 | 0.3659 |
| Basal area (m2/ha) | 0.681 | 0.6053 |
| ANOVA was conducted across five age groups (df_effect = 4, df_resid = 495). AGB: Aboveground biomass, DBH: Diameter at breast height | ||
Stand volume also showed significant differences (F = 4.36, p = 0.0018), likely reflecting differences in stand density and tree form across plots. In contrast, DBH, aboveground biomass (AGB), carbon stock, and basal area did not vary significantly among age groups (p>0.05). This suggests that despite variations in tree height and stand volume, overall biomass accumulation and carbon storage remained relatively stable across age classes. Overall, the results indicate that vertical structural growth (height and bole height) is more sensitive to stand age and environmental variability, whereas biomass and carbon accumulation are primarily determined by individual tree size rather than chronological age shown in Table 2.
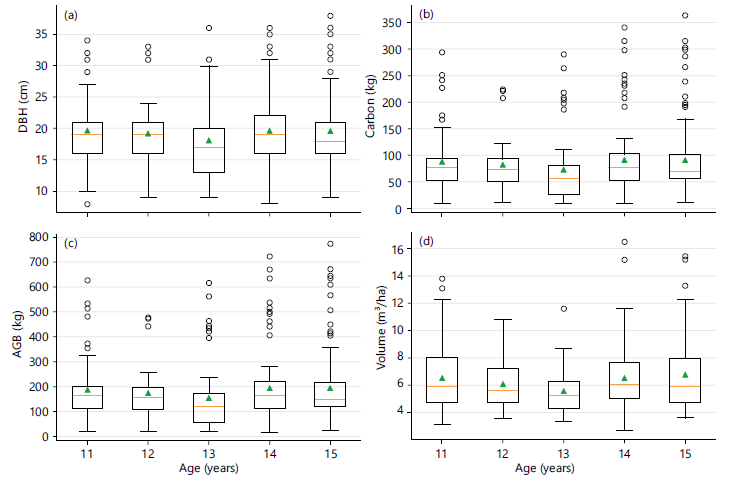
Distribution patterns of key growth and carbon variables: The boxplots illustrate the distribution of key growth and carbon variables across different age groups (Fig. 1). The distribution of diameter at breast height (DBH) is relatively consistent across ages 11-15, with similar medians and substantial overlap among groups (Fig. 1a). For instance, median DBH values range from 18.5 cm at age 12 to 20.1 cm at age 15. Although some outliers are present, variation within each age class is greater than variation among age groups, suggesting that age does not strongly influence DBH in this stand. This pattern is consistent with the ANOVA results, which showed no significant differences among age classes. For carbon stock per tree, the distributions also remain fairly uniform across ages (Fig. 1b). Median values range narrowly between 73.2 kg at age 11 and 81.5 kg at age 15. While the mean values (green triangles) are slightly higher at ages 14 (85.3 kg) and 15 (89.1 kg), the differences are small and statistically non-significant (p = 0.239). Each age group shows several high-value outliers exceeding 150 kg per tree, indicating that a few trees store disproportionately large amounts of carbon. This variation suggests that carbon accumulation is primarily driven by tree size heterogeneity rather than stand age. Similarly, aboveground biomass (AGB) per tree exhibits comparable median values across all ages, generally between 152.4 kg at age 11 and 168.7 kg at age 15 (Fig. 1c). Mean AGB increases slightly in the 14- and 15-year-old stands, reaching 176.5 kg and 183.2 kg, respectively, but these differences are not statistically significant (p = 0.240). The large spread and frequent outliers, with some individual trees exceeding 300 kg, indicate that a small proportion of trees contribute disproportionately to stand-level biomass. Thus, biomass variation is largely due to differences in individual tree size rather than stand age. In contrast, stand volume displays a clearer increasing trend with age (Fig. 1d). Median values rise progressively from 5.2 m3/ha at age 11 to 7.8 m3/ha at age 15, while mean values are correspondingly higher in the older stands (7.3 m3/ha at age 14 and 8.1 m3/ha at age 15). Although overlap exists among age groups, older stands exhibit greater variability and higher maximum values, with some 15-year-old stands exceeding 12 m3/ha. This pattern aligns with the ANOVA results (p = 0.0018), confirming significant differences in stand volume among age classes. The trend indicates that as stands mature, total volume and productivity tend to increase, reflecting progressive structural development and enhanced site utilization.
|
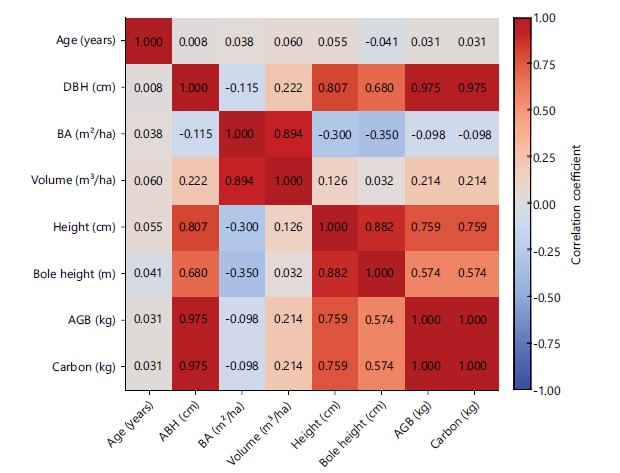
Correlation among growth, biomass, and carbon variables: The correlation analysis revealed strong positive relationships among several structural and biomass-related variables. Tree diameter (DBH) was the strongest predictor of growth and productivity parameters, showing very high correlations with both aboveground biomass (r = 0.975) and carbon stock (r = 0.975). The DBH also exhibited strong associations with tree height (r = 0.807) and bole height (r = 0.680), indicating that diameter expansion is closely linked to overall tree form and vertical development. Tree height and bole height were also highly correlated (r = 0.882), confirming that trees with greater total height tend to have proportionally longer boles. Height showed a strong positive relationship with both biomass and carbon (r = 0.759), underscoring its role as a secondary predictor of biomass accumulation. In contrast, basal area (BA) was negatively correlated with height (r = -0.30) and bole height (r = -0.35), suggesting that denser stands may limit individual tree height through competitive suppression. However, basal area exhibited a strong positive correlation with stand volume (r = 0.894), implying that higher density and cumulative stem area contribute substantially to total stand productivity, even if individual trees grow shorter. Age showed very weak correlations with all measured variables, reflecting that within the narrow range of 11-15 years, variation in growth and biomass is driven primarily by tree size and competitive interactions rather than chronological age. Overall, the results highlight DBH as the key determinant of aboveground biomass and carbon storage, while basal area serves as an indicator of stand-level competition and density effects (Fig. 2).
|
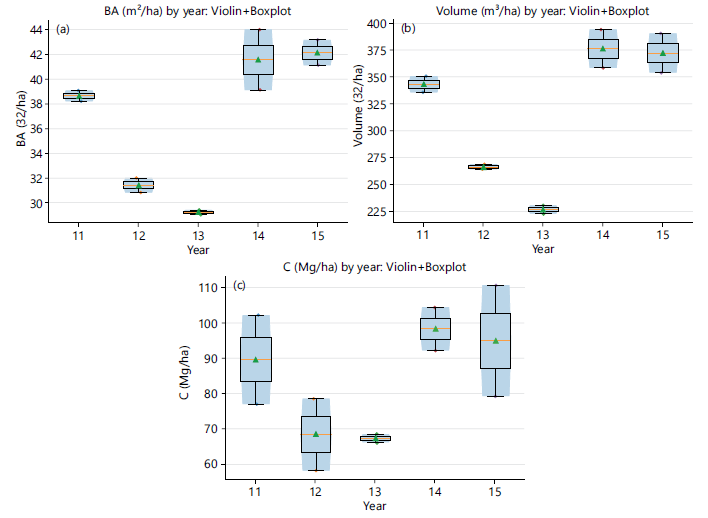
Age-related variation in stand structure and carbon storage: The violin and boxplots illustrate clear age-related differences in structural and carbon storage variables (Fig. 3). For basal area (BA, m2/ha), younger stands (11-13 years) show lower mean values, ranging between 29 and 38 m2/ha, while older stands (14-15 years) exhibit considerably higher basal areas, averaging 41-43 m2/ha (Fig. 3a). The distribution widens notably at age 14, suggesting greater variability among plots, whereas other age groups display tighter clustering. This progressive increase in basal area with stand age reflects normal stand development, as trees expand in diameter and cumulative stem area increases. Overall, the results highlight that stand density and tree size interact to drive basal area growth, with older plantations contributing most to stand-level dominance and productivity. The pattern for stand volume (m3/ha) similarly reveals distinct age-related trends (Fig. 3b). Younger stands (11-13 years) exhibit lower mean volumes (220-350 m3/ha) and a temporary decline at age 13 before increasing sharply in older groups. Stands aged 14-15 years show much higher mean volumes (370-380 m3/ha) with broader distributions, indicating greater variability among plots. These trends confirm that stand volume increases markedly with age, driven by cumulative biomass accumulation and stand development. Thus, older stands represent the period of peak productivity in these plantations. For carbon stock (C, Mg/ha), clear differences are evident among age groups (Fig. 3c). Younger stands (12-13 years) have lower carbon levels, averaging 65-70 Mg/ha with narrow distributions that reflect relatively uniform carbon accumulation.
|
Model selection for dbh-height relationship: Model comparison results indicated that the logarithmic model provided the best fit among the tested functions (Table 3). This model achieved the lowest AIC value (-4315.45), the highest coefficient of determination (R2 = 0.75), and the lowest prediction error (RMSE = 0.0133). These metrics confirm that the logarithmic model explained approximately 75% of the variation in tree height and offered strong predictive accuracy. The power model also performed relatively well (R2 = 0.72, RMSE = 0.0141) but was clearly less efficient than the logarithmic form, as reflected by its higher AIC value (4254.32). In contrast, the asymptotic and Weibull models performed extremely poorly, with large positive AIC values (≈111-113), highly negative R2 values (-1749), and high RMSE (~1.11). These statistics indicate poor model convergence and substantial deviations between predicted and observed values, rendering them unreliable for this dataset. Overall, the results demonstrate that the logarithmic model is the most suitable functional form for describing the relationship between DBH and height in Acacia mangium plantations. This finding is consistent with previous studies in tropical plantations, where the DBH-height relationship typically follows a logarithmic trend due to diminishing height growth with increasing tree diameter.
| Table 3: | Comparison of nonlinear models describing the relationship between diameter at breast height (DBH) and total tree height in Acacia mangium plantations (n = 500) | |||
| Model | AIC | R2 | RMSE | n | k |
| log | -4315.45 | 0.749725 | 0.013307 | 500 | 2 |
| power | -4254.32 | 0.717177 | 0.014146 | 500 | 2 |
| asym13 | 110.8955 | -1749.21 | 1.112818 | 500 | 2 |
| weib13 | 112.8955 | -1749.21 | 1.112818 | 500 | 3 |
| AIC: Akaike Information Criterion, RMSE: Root mean square error, n: Number of observations and k: Number of parameters | |||||
|
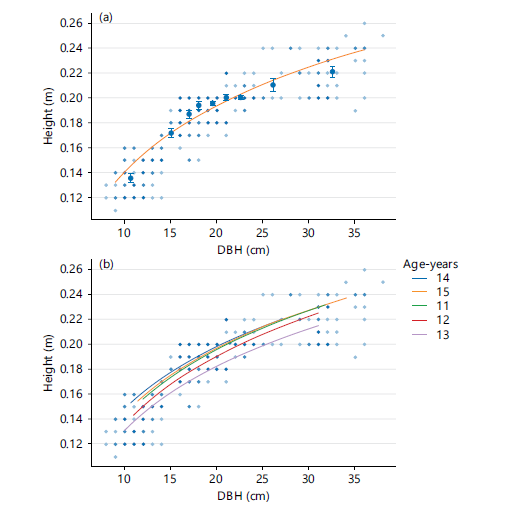
The scatter plots demonstrate a clear positive relationship between DBH and tree height, as described by the best-fit logarithmic model (Fig. 4a-b). The model explained approximately 75% of the total variation (R2 ≈ 0.75) with a low prediction error (RMSE ≈ 0.0133), confirming its high predictive accuracy. As DBH increases from about 10 cm to 35 cm, tree height rises correspondingly from ~0.13 m to ~0.24 m, after which the curve gradually flattens. This asymptotic trend indicates that height growth slows with increasing tree size, reflecting physiological limits and competitive equilibrium typical of maturing stands. The binned means with 95% confidence intervals align closely with the fitted curve, further supporting the model’s reliability and robustness. Figure 5(a-c) illustrates the fitted logarithmic relationships between DBH and tree height across five age groups (11-15 years). In all cases, height increased with DBH, but the curves differ in both slope and elevation. Trees in the older age classes (14-15 years) display higher fitted curves, reaching maximum heights of approximately 0.24-0.25 m at larger diameters, whereas younger groups (11-13 years) exhibit lower curves, with maximum heights closer to 0.20-0.22 m. This indicates that, for a given DBH, older trees tend to be taller, reflecting age-related improvements in vertical growth and canopy dominance. The strong alignment of data points with fitted curves further confirms the suitability of the logarithmic model for predicting height from DBH in Acacia mangium stands. Overall, the results demonstrate that DBH is a reliable and dominant predictor of tree height, but the relationship is nonlinear, with diminishing height increments as trees reach larger diameters. Moreover, stand age modifies this relationship, with older trees achieving greater height for a given DBH, emphasizing the combined influence of structural maturity and growth stage on vertical development.
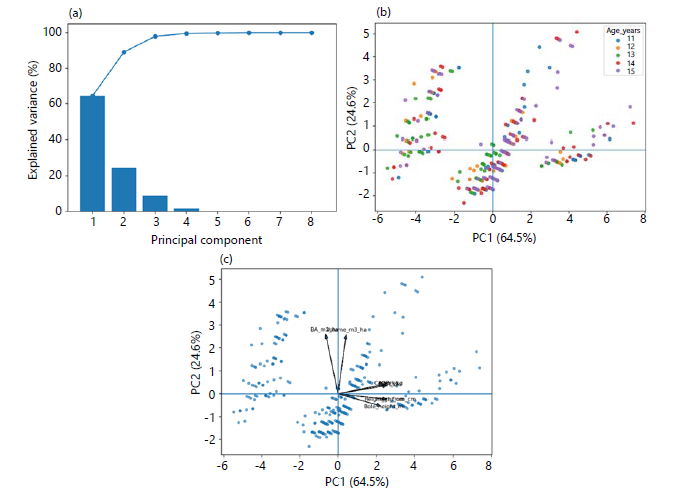
Principal Component Analysis (PCA) of stand attributes: The PCA results reveal the main axes of variation in stand structure and growth attributes (Fig. 5). The scree plot shows the proportion of variance explained by each principal component (Fig. 5a). The first component (PC1) accounts for approximately 65% of the total variance, while the second component (PC2) explains about 25%, and the third component contributes roughly 8%. Together, the first three components capture nearly 98% of the total variability in the dataset. The remaining components each explain less than 1%, indicating that they add little additional information. This pattern confirms that the dataset can be effectively reduced to two or three principal components without significant loss of explanatory power, making PCA suitable for dimensionality reduction and visualization. The PCA biplot of sample distribution (PC1 vs. PC2) illustrates that the first two components together explain almost 90% of the total variance (PC1 = 64.5%, PC2 = 24.6%) (Fig. 5b). The samples are widely distributed along PC1, which represents the dominant source of variation in the dataset, while PC2 provides additional but secondary differentiation. Points corresponding to different age groups (11-15 years) exhibit partial overlap, yet clear trends emerge: older stands (ages 14-15) cluster more on the positive side of PC1, whereas younger stands (ages 11-12) are positioned toward the negative side. This pattern suggests that PC1 captures growth-related differences associated with DBH, height, and biomass accumulation, while PC2 likely reflects structural or density-related variation. The PCA loading plot (Fig. 5c) clarifies the contribution of individual variables to the principal components. DBH, aboveground biomass (AGB), and carbon stock show strong positive loadings along PC1, indicating that they are the dominant drivers of overall variation. Height and bole height also load positively on PC1, though with shorter vectors, suggesting moderate contributions. In contrast, basal area (BA) and stand volume load more strongly along PC2, representing a secondary gradient associated with stand structure and density.
|
Overall, PCA identified two major structural dimensions:
| • | PC1 (size-biomass axis): Dominated by DBH, AGB, carbon, and height, reflecting individual tree growth and biomass accumulation | |
| • | PC2 (stand structure axis): Driven by basal area and volume, representing stand density and structural differentiation |
Together, these two components explain nearly 90% of the total variance, highlighting that tree growth and stand density are the principal factors distinguishing the structural attributes of Acacia plantations.
DISCUSSION
Our analysis demonstrates that stand structure in Acacia mangium plantations is dominated by a size-biomass dimension, with DBH emerging as the single most important predictor of aboveground biomass (AGB) and carbon storage. DBH exhibited a very strong correlation with both AGB and carbon (r ≈ 0.98), while height was also positively related but showed diminishing returns at larger diameters. The best-fitting logarithmic model (R² ≈ 0.75) indicates that tree height increases rapidly with DBH at smaller sizes and then plateaus as trees mature. This pattern is consistent with tropical allometric relationships described by Chave et al.9 and with nonlinear height-diameter (H-D) functions reported across diverse forest ecosystems11. The asymptotic relationship reflects biological limits to height growth and confirms that DBH serves as a more stable and reliable driver of biomass and carbon accumulation than height. Age-group comparisons further revealed that tree height, bole height, and stand volume differed significantly among groups, while DBH, AGB, and carbon did not. This finding suggests that vertical growth is more sensitive to site conditions, density, and age, whereas per-tree biomass accumulation remains relatively stable within the 11-15-year range. The higher height curves observed in older stands imply continued vertical growth even as diameter expansion slows, consistent with the use of height-based site index as an indicator of productivity15. These trends emphasize that plantation productivity is shaped not only by diameter growth but also by vertical structure and site-specific factors. Competition and stand density also play pivotal roles in shaping stand structure. Basal area correlated strongly with stand volume per hectare (r = 0.89) but negatively with height and bole height, indicating that dense stands constrain vertical growth while enhancing total wood volume. This outcome aligns with classical size-density relationships described in stand density index theory22,23, and supports the concept that self-thinning and crowding reduce individual height gains14. Biomass and carbon accumulation were highly unevenly distributed, with a small proportion of large trees contributing disproportionately to total carbon storage-a pattern consistent with global findings that large-diameter trees dominate forest carbon pools24,25. This highlights the ecological importance of maintaining large individuals for maximizing ecosystem carbon sequestration. Finally, Principal Component Analysis (PCA) confirmed the structural dimensions underlying stand variability. The PC1 (64.5%) represented the tree size-biomass axis, primarily defined by DBH, height, AGB, and carbon, while PC2 (24.6%) reflected the stand structure-density axis, dominated by basal area and volume. Together, these components explained nearly 90% of the total variation, indicating that tree size growth and stand density jointly determine stand productivity and carbon dynamics. Collectively, these findings underscore that optimizing both individual tree growth (through silvicultural management that enhances DBH and height) and stand density (through appropriate thinning or spacing) is essential to maximize productivity and carbon sequestration potential in Acacia plantations.
CONCLUSION
This study demonstrated that Acacia mangium plantations aged 11-15 years in Cambodia are structurally dominated by tree size, with DBH emerging as the key predictor of biomass and carbon (r ≈ 0.98). Height and bole height showed secondary effects, reflecting age and site influences. Significant differences among age groups were found for height, bole height, and stand volume, while biomass and carbon remained stable. The logarithmic DBH-height model best described growth patterns (R2 ≈ 0.75), and PCA revealed two structural dimensions: Tree size-biomass and stand density-volume. Overall, enhancing diameter growth and maintaining optimal stand density are crucial for maximizing productivity and carbon sequestration in Acacia plantations.
SIGNIFICANCE STATEMENT
This study provides new quantitative evidence on how stand structure and tree growth regulate aboveground biomass and carbon storage in Acacia plantations of Cambodia. By integrating classical forest mensuration with multivariate analysis and nonlinear modeling, the research identifies diameter at breast height (DBH) as the dominant driver of biomass and carbon accumulation, while stand density and structural attributes primarily influence stand development. The findings offer practical guidance for plantation management by demonstrating that optimizing tree size distribution and stand density can substantially enhance carbon sequestration potential. These insights directly support climate-change mitigation strategies, sustainable plantation management, and national carbon accounting efforts in tropical plantation systems.
ACKNOWLEDGMENT
This study was financially supported by the Research Team of the Royal University of Agriculture. The authors would like to express their sincere gratitude to the editors and expert reviewers of the Trends in Environmental Sciences for their valuable feedback and suggestions to improve this manuscript.
REFERENCES
- Pan, Y., R.A. Birdsey, J. Fang, R. Houghton and P.E. Kauppi et al., 2011. A large and persistent carbon sink in the world’s forests. Science, 333: 988-993.
- Baccini, A., S.J. Goetz, W.S. Walker, N.T. Laporte and M. Sun et al., 2012. Estimated carbon dioxide emissions from tropical deforestation improved by carbon-density maps. Nat. Clim. Change, 2: 182-185.
- Evans, J. and J.W. Turnbull, 2004. Plantation Forestry in the Tropics: The Role, Silviculture, and Use of Planted Forests for Industrial, Social, Environmental, and Agroforestry Purposes. 3rd Edn., Oxford University Press, New York, USA, ISBN: 9781383024920, Pages: 482.
- Hansen, M.C., P.V. Potapov, R. Moore, M. Hancher, S.A. Turubanova et al., 2013. High-resolution global maps of 21st-century forest cover change. Science, 342: 850-853.
- Sarun, H., R. Chanra, H. Meta, H. Linan, T. Pang and C. Savvong, 2025. Assessment of species diversity, biomass, and carbon stock in mangrove forests of Prey Nop District, Preah Sihanouk Province, Cambodia. J. Agric. Technol., 1: 30-40.
- Heriansyah, I., K. Miyakuni, T. Kato, Y. Kiyono and Y. Kanazawa, 2007. Growth characteristics and biomass accumulations of Acacia mangium under different management practices in Indonesia. J. Trop. For. Sci., 19: 226-235.
- Harwood, C.E. and E.K.S. Nambiar, 2014. Productivity of acacia and eucalypt plantations in Southeast Asia. 2. trends and variations. Int. For. Rev., 16: 249-260.
- Luyssaert, S., E.D. Schulze, A. Borner, A. Knohl and D. Hessenmoller et al., 2008. Old-growth forests as global carbon sinks. Nature, 455: 213-215.
- Chave, J., M. Réjou‐Méchain, A. Búrquez, E. Chidumayo and M.S. Colgan et al., 2014. Improved allometric models to estimate the aboveground biomass of tropical trees. Global Change Biol., 20: 3177-3190.
- Brown, S. and FAO, 1997. Estimating Biomass and Biomass Change of Tropical Forests: A Primer. Food & Agriculture Org., lllinois, Nigeria, ISBN: 9789251039557, Pages: 55.
- Huang, S., S.J. Titus, and D.P. Wiens, 1992. Comparison of nonlinear height-diameter functions for major Alberta tree species. Can. J. For. Res., 22: 1297-1304.
- Lehtonen, A., R. Mäkipää, J. Heikkinen, R. Sievänen and J. Liski, 2004. Biomass expansion factors (BEFs) for Scots pine, Norway spruce and birch according to stand age for boreal forests. For. Ecol. Manage., 188: 211-224.
- Kettering, Q.M., R. Coe, M. van Noordwijk, Y. Ambagau and C.A. Palm, 2001. Reducing uncertainty in the use of allometric biomass equations for predicting above-ground tree biomass in mixed secondary forests. For. Ecol. Manage., 146: 199-209.
- Pretzsch, H., 2009. Forest Dynamics, Growth and Yield: From Measurement to Model. 1st Edn., Springer, Berlin/Heidelberg, Germany, ISBN: 978-3-540-88307-4, Pages: 664.
- Skovsgaard, J.P. and J.K. Vanclay, 2008. Forest site productivity: A review of the evolution of dendrometric concepts for even-aged stands. Forestry, 81: 13-31.
- Baird, I.G., 2020. Problems for the plantations: Challenges for large-scale land concessions in Laos and Cambodia. J. Agrar. Change, 20: 387-407.
- Yona, L., B. Cashore, R.B. Jackson, J. Ometto and M.A. Bradford, 2020. Refining national greenhouse gas inventories. Ambio, 49: 1581-1586.
- Field, A., 2024. Discovering Statistics Using IBM SPSS Statistics. 6th Edn., SAGE Publications, Thousand Oaks, California, ISBN: 9781529668711 Pages: 1144.
- Zar, J.H., 1999. Biostatistical Analysis. 4th Edn., Prentice-Hall, New Jersey, ISBN: 9780130815422, Pages: 663.
- Cohen, J., 1988. Statistical Power Analysis for the Behavioral Sciences. 2nd Edn., Routledge, New York, USA, ISBN: 9780203771587, Pages: 567.
- Burnham, K.P. and D.R. Anderson, 2002. Model Selection and Multimodel Inference: A Practical Information-Theoretic Approach. 2nd Edn., Springer, New York, ISBN: 978-0-387-22456-5, Pages: 488.
- Jolliffe, I.T. and J. Cadima, 2016. Principal component analysis: A review and recent developments. Philos. Trans. R. Soc. A, 374.
- Zeide, B., 2005. How to measure stand density. Trees Struct. Funct., 19: 1-14.
- Kim, S., S. Horn, P. Sok, T. Sien and C. Yorn, 2023. Ecosystem carbon stock assessment in upland forest: A case study in Koh Kong, Mondulkiri, Preah Vihear, and Siem Reap Provinces. Int. J. Environ. Rural Dev., 14: 61-67.
- Lutz, J.A., T.J. Furniss, D.J. Johnson, S.J. Davies and D. Allen et al., 2018. Global importance of large-diameter trees. Global Ecol. Biogeogr., 27: 849-864.
How to Cite this paper?
APA-7 Style
Sarun,
H., Lyhour,
H., Sophea,
N., Sopheak,
T., Sokra,
I. (2026). Stand Structure and Growth Drivers of Aboveground Biomass and Carbon in Acacia Plantations. Trends in Environmental Sciences, 2(2), 156-168. https://doi.org/10.21124/tes.2026.156.168
ACS Style
Sarun,
H.; Lyhour,
H.; Sophea,
N.; Sopheak,
T.; Sokra,
I. Stand Structure and Growth Drivers of Aboveground Biomass and Carbon in Acacia Plantations. Trends Env. Sci 2026, 2, 156-168. https://doi.org/10.21124/tes.2026.156.168
AMA Style
Sarun
H, Lyhour
H, Sophea
N, Sopheak
T, Sokra
I. Stand Structure and Growth Drivers of Aboveground Biomass and Carbon in Acacia Plantations. Trends in Environmental Sciences. 2026; 2(2): 156-168. https://doi.org/10.21124/tes.2026.156.168
Chicago/Turabian Style
Sarun, Horn, Hin Lyhour, Nhean Sophea, Thav Sopheak, and In Sokra.
2026. "Stand Structure and Growth Drivers of Aboveground Biomass and Carbon in Acacia Plantations" Trends in Environmental Sciences 2, no. 2: 156-168. https://doi.org/10.21124/tes.2026.156.168

This work is licensed under a Creative Commons Attribution 4.0 International License.