Bacterial Isolation from Groundnut Farm Soil in Katagum, Bauchi State, Nigeria
-
Ahmed Idriss Jajere


Department of Biological Sciences, Federal University Gashua, Gashua, Yobe State, Nigeria
Suleiman AbdullahiDepartment of Biological Sciences, Federal University Gashua, Gashua, Yobe State, Nigeria
| Received 19 Mar, 2025 |
Accepted 23 Jun, 2025 |
Published 30 Sep, 2025 |
Background and Objective: Soil is a dynamic ecosystem containing diverse microbial communities that significantly impact crop health and productivity. In groundnut (Peanut) farming, both beneficial and pathogenic soil bacteria influence yield. This study aimed to isolate and identify bacterial species in groundnut farm soil from Katagum, Bauchi State, Nigeria, and to assess its physical and chemical properties to determine their agricultural implications. Materials and Methods: Soil samples were collected from a groundnut farm and analyzed using standard microbiological and physicochemical procedures. Bacteria were isolated through spread plating on nutrient agar and incubated at 37°C for 24 hrs. Biochemical tests, including methyl red, oxidase, catalase, Voges-Proskauer, Indole, Gram staining, and Cot analysis, were employed for bacterial identification. Mineral and heavy metal contents were quantified using atomic absorption spectrophotometry (AAS) following microwave digestion with nitric acid and hydrogen peroxide. Soil texture was evaluated through the sedimentation method using Calgon solution. Results: Two dominant bacterial species, Staphylococcus aureus and Escherichia coli, were isolated and identified. The soil samples showed notable textural differences: One sample contained higher silt (76%) and sand (60%), while the other had increased clay content (46.8%). All procedures were conducted using analytical-grade reagents and calibrated equipment. Conclusion: The study reveals a strong link between soil texture and microbial composition, providing foundational knowledge for improving soil health and enhancing groundnut productivity. The results serve as a basis for future research on microbial interventions and inform soil management strategies for sustainable agriculture in the region.
| Copyright © 2025 Jajere and Abdullahi. This is an open-access article distributed under the Creative Commons Attribution License, which permits unrestricted use, distribution, and reproduction in any medium, provided the original work is properly cited. |
INTRODUCTION
Bacteria, the most abundant microorganisms on Earth, play a crucial role in various ecological processes and have a significant impact on human health. They are single-celled organisms that can be found in diverse environments, ranging from soil and water to the human body. Understanding the characteristics, behavior, and interactions of bacteria is essential for numerous fields, including medicine, agriculture, and environmental science. Research on bacteria has witnessed significant advancements due to the emergence of new technologies and methodologies. This has led to the discovery of novel bacterial species, the exploration of their genetic diversity, and a deeper understanding of their functional capabilities. Furthermore, the application of advanced techniques such as genomics, metagenomics, and high-throughput sequencing has revolutionized our ability to study bacteria at a molecular level. One area of particular interest in bacterial research is their role in human health1. Bacteria can have both beneficial and detrimental effects on human well-being. For example, the human gut microbiota, which consists of trillions of bacteria, has been shown to play a crucial role in digestion, nutrient metabolism, and immune system development. Recent studies have also highlighted the association between the gut microbiota and various diseases, including obesity, diabetes, and inflammatory bowel diseases1. Moreover, the emergence of antibiotic-resistant bacteria has become a major global concern. Infections caused by resistant bacteria are challenging to treat and can lead to increased morbidity and mortality rates. Recent studies have focused on understanding the mechanisms by which bacteria acquire antibiotic resistance, as well as developing strategies to combat this growing problem2. In the field of environmental science, bacteria are known to play a vital role in nutrient recycling and ecosystem functioning. Recent research has highlighted the importance of bacterial communities in maintaining ecosystem stability and resilience. For example, bacteria are involved in the degradation of organic matter, nutrient recycling, and the removal of pollutants from the environment3. Bacteria are crucial at many stages of the nutrition cycle by recycling nutrients, such as the fixation of nitrogen from the atmosphere. The nutrient cycle includes the breakdown of dead bodies, and bacteria are in charge of the putrefaction stage of this process4. Extremophile bacteria transform dissolved substances like hydrogen sulfide and methane into energy to support life in the biological communities that surround hydrothermal vents and cold seeps. This study aims to isolate and identify bacterial species present in groundnut farm soil from Katagum, Bauchi State, Nigeria. The findings will help understand the microbial composition of the soil, its potential agricultural benefits, and its impact on soil health and crop productivity.
MATERIALS AND METHODS
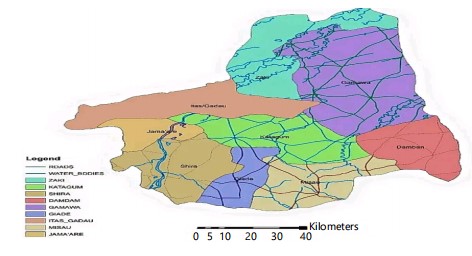
Study area: Katagum is a town, local government area, and traditional emirate in Northeastern Nigeria's Bauchi State. It lies on the Jama'are River, a tributary of the Hadejia (Fig. 1). The population is primarily made up of Fulani, Kanuri, Karai-Karai, and Hausa ethnic groups. Agriculture is a key sector, with crops like peanuts, sorghum, millet, rice, cowpeas, cotton, indigo, and gum arabic. Livestock farming is also prevalent, with horses, cattle, goats, sheep, donkeys, and poultry being raised.
Collection of the sample: A soil sample was collected from the rhizosphere of a groundnut plant. This collection took place on July 21, 2023, at the farms of Mal Ibarahim Bidawa Ward and Alh Sadiq Dalli in Katagum Local Government, Bauchi State, Nigeria. The soil was placed in a clean container with a screw top using the provided soil agar. The sample was then immediately transported to the microbiology laboratory at Yobe State University (YSU), Yobe State, Nigeria for further analysis.
|
Experimental design: To isolate and identify bacteria, 200 g of each sample of soil (from farms) was gathered from groundnut farms in Katagum Local Government, Bauchi State North Eastern Nigeria. Before taking the samples, the farmer was verbally questioned to learn more about his groundnut farm and instructed on the objective of sampling. The samples collected from the first farm were designated SO-A, whereas the ones collected from the second farm were designated SO-B.
Media preparation: Standard media were prepared based on the manufacturer’s instructions. The specified media used for this study include Oxoid™ Media.
Nutrient agar, MacConkey agar, Eosin methylene blue agar, Mannitol salt agar, Simon citrate agar, Salmonella shigella agar, Urea agar Base, Tryptone broth, and MR-VP broth medium, produced by Thermo-Fisher Scientific, Waltham, Massachusetts, USA5.
Serial dilution/Pour plating method: A teaspoon of the soil sample was added to the first tube and mixed well. To the remaining 4 tubes, 9 mL of distilled water was added. These five conical test tubes were labeled as stock sample, 1/10, 1/100, 1/1000, and 1/10000, respectively. The 1 mL from the stock sample tube was transferred into tube “2 (1/10)” and mixed well. 1 mL from tube “2 (1/10)” was transferred into tube “3 (1/100)” and mixed well. 1 mL from tube “3 (1/100)” was taken and added into tube “4 (1/1000)” and mixed well. Then, 1 mL from tube “4 (1/1000)” was transferred into tube “5 (1/10000)” and mixed well.
Spread plating: 4 nutrient agar plates are to be labeled as (1/10), (1/100), (1/1000), (1/10000), respectively. Each agar plate is to be inoculated with 1 mL of the corresponding suspension using different sterile disposable syringes. The suspensions are to be spread evenly over the agar plates and allowed to dry. The pour-inoculated agar plates are then incubated aerobically at 37°C for 24 hrs. They are to be observed the following day for visible growth.
Biochemical identification: The biochemical identification tests used for this study for pathogenic identification and confirmation of soil bacteria include the methyl red test, oxidase test, catalase test, Cot analysis, and Voges-Proskauer test.
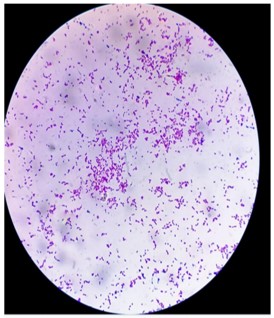
Gram staining method: The staining method is a cornerstone technique in the field of diagnostic bacteriology. Clean slides with heat-fixed bacterial smears were prepared. Crystal violet was applied to the smears for 1 min and then rinsed with water. Subsequently, Lugol’s iodine was added for one minute, followed by another water rinse. The smears, initially appearing purple, were then decolorized with 95% ethyl alcohol for 5-10 sec. To counterstain, safranin was applied for 45 sec, followed by a water rinse and air drying. Finally, the stained slides were examined under an oil immersion microscope at 100×magnification6.
Catalase test: The enzyme catalase breaks down hydrogen peroxide into oxygen and water. This principle is used for the detection of the catalase enzyme in a bacterial isolate. A loopful of 10% hydrogen peroxide was put on colonies of the test organism on nutrient agar. Alternatively, a few colonies of the organism were picked up with a platinum wire loop from a nutrient agar plate and dipped in a drop of 10% hydrogen peroxide on a clean slide. The production of gas bubbles from the culture indicates a positive reaction. A false positive result may be obtained if the growth is picked up from the medium containing catalase, e.g, blood agar, or if an iron wire loop is used6.
Oxidase test: This test depends on the presence, in bacteria, of certain oxidases that catalyze the oxidation of reduced Tetramethyl-p-phenylene-diamine dihydrochloride (oxidase reagent) by molecular oxygen. A drop of a freshly prepared 1% solution of oxidase reagent was put on a piece of filter paper. Then, a few colonies of the test organism were rubbed on it. Oxidase-positive isolates produced a deep purple colour within 10 sec. Alternatively, the oxidase reagent will be poured over the colonies of the test organism on a culture plate. The colonies of oxidase-positive bacteria rapidly develop a deep purple colour6.
|
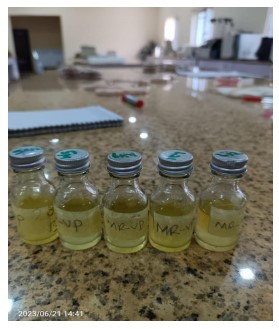
Methyl red test (MR): This test detects the production of sufficient acid by fermentation of glucose so that the pH of the medium falls and it’s maintained below 4.5. The isolates were inoculated in glucose phosphate broth and incubated at 37°C for 2-5 days. Then, five drops of 0.004% solution of methyl red were added, mixed well, and the result was read immediately (Fig. 2). Positive tests are bright red (indicating low pH), and the negative ones are yellow5.
Voges-proskauer test: Before inoculation, the medium is equilibrated to room temperature. Using organisms taken from an 18 to 24 hrs pure culture, lightly inoculate the medium. Incubate aerobically at 37 for 24 hrs. Following 24 hrs of incubation, aliquot 2 mL of the broth into a clean test tube. Re-incubate the remaining broth for an additional 24 hrs. Add 6 drops of 5% alpha-naphthol and mix well to aerate. Add 2 drops of 40% potassium hydroxide and mix well to aerate. Observe for a pink-red color at the surface within 30 min. Shake the tube vigorously during the 30 min5.
Cot analysis: The procedure involves heating a sample of genomic DNA until it denatures into the single-stranded form and then slowly cooling it, so the strands can pair back together. While the sample is cooling, measurements are taken of how much of the DNA is base-paired at each temperature7.
Indole test: Certain bacteria that possess the enzyme Tryptophanase degrade the amino acid tryptophan to indole, pyruvic acid, and ammonia. Indole production was detected by inoculating the isolates into peptone water and incubating them at 37°C for 48-96 hrs. Then 0.5 mL of Kovac’s reagent was added gently. A red color in the alcohol layer indicates a positive reaction5.
Minerals/Heavy metals analysis: The equipment and instruments used in this study were all calibrated to check the ir status before and in the middle of the experiments. Apparatus such as volumetric flasks, measuring cylinders, and digestion flasks were thoroughly washed with detergents and tap water and then rinsed with deionized water. All glasswares were cleaned with 10% concentrated Nitric acid (HNO3) to clear out any heavy metal on their surfaces and then rinsed with distilled-deionized water. The digestion tubes were soaked with 1% (w/v) potassium dichromate in 98% (v/v) H2SO4, and the volumetric flasks in 10% (v/v) HNO3 for 24 hrs, followed by rinsing with deionized water and then dried in the oven and kept in dust dust-free place until analysis began. Before each use, the apparatus was soaked and rinsed in deionized water7.
Equipment and apparatus:
Equipment and apparatus used include:
| • | Analytical balance, 250-g capacity, resolution 0.0001g, OHAUS, PA214 Pioneer USA | |
| • | Glassware: Borosilicate volumetric flasks (25, 50, 100, and 1000 mL), measuring cylinders | |
| • | Micropipettes (1-10 and 100-1000 mL) | |
| • | Atomic absorption spectrophotometer (Buck Scientific model 210VGP AAS, USA; equipped with hollow cathode lamps and air-acetylene flame) | |
| • | Microwave digester (Master 40 serial number: 40G106M) |
Reagents and chemicals
Reagents and chemicals used for the laboratory work were all of analytical grade: Deionized water (chemically pure with conductivity 1.5 μs/cm and below was prepared in the laboratory) was used for the dilution of the sample and intermediate metal standard solutions before analysis and rinsing glassware and sample bottles.
Sample pre-treatment/digestion (solid sample): The 1.0 g of the sample was weighed into a thoroughly clean digestion vessel (microwave tube), and 6 mL of 65% HNO3 and 2 mL of H2O2 were added and allowed to stand for a while. The digestion vessel (microwave tube) was then covered and placed into the microwave digester (Master 40 serial No: 40G106M) and digested. The digestion was carried out at a temperature of 75°C for 10 min and then ramped at 100°C per minute to 95°C and held for 30 min. The digestion was followed by a cooling to room temperature in the microwave. Blanks were used simultaneously in each batch of the analysis to authenticate the analytical quality. The digested samples were diluted with deionized water to a total volume of 100 mL7.
Preparation of 1000 mg/L stock AAS standard solution for selected elements: The determination of a given metal concentration in the experimental solution was based on its respective calibration curve. In plotting the calibration curves for lead, cadmium, zinc, and other metals, a stock solution of each metal ion of 1000 ppm supplied by Fisher Scientific was used, from which a standard working solution of 100 ppm was prepared8.
Standard working solution: The 100 ppm was prepared as a working solution from the 1000 ppm already prepared. A simple dilution formula (C1V1 = C2V2) was used to calculate the volume of the stock solution to be diluted to the new desired concentration. 1 mL of concentrated HNO3 was added to each working standard and finally diluted to the desired volume with deionized water. To prepare 100 ppm, 10 mL of the standards and other stock solutions were pipetted and added into 100 mL calibrated flasks, finally diluted with deionized water, and the solution was mixed thoroughly. The other standard working solutions were prepared from 100 ppm by pipetting out an appropriate volume into calibrated flasks and made up to volume with deionized water8,9.
Determination of elements by AAS
Preparation of calibration curve: The instrument was calibrated using a series of working standards. The working standard solutions of each metal were prepared from standard solutions of their respective metals, and their absorbances were taken using the AAS. A calibration curve for each metal ion to be analyzed was prepared by plotting the absorbance as a function of metal ion standard concentration8.
Soil texture test by sedimentation technique: Measure the relative amounts of sand, silt, and clay in a soil sample. This activity is based on the fact that large, heavy particles will settle most rapidly in water, while small, light particles will settle most slowly. The laundry detergent is used to dissolve the soil aggregates and keep the individual soil particles separated:
| • | Determine and calculate the amount of sand, silt, and clay in a given soil sample | |
| • | Determine the textural class by using a textural soil triangle | |
| • | Recognize the differences in soil textures |
Materials: Soil sample, One-pint fruit jar with lid, Distilled water, Eight percent Calgon solution, mix three tablespoons of Calgon per one pint of water or 1 teaspoon nonfoaming laundry detergent, Metric ruler, Measuring cup, Tablespoon
Procedure:
| • | Place a 1/2 cup of soil sample in the jar. Add 1.5 cups of distilled water and 3 tablespoons of the Calgon solution | |
| • | Cap the jar and shake for 5 min. Leave the jar on the desk. Allow it to settle for 24 hrs | |
| • | After 24 hrs, measure the depth of the settled soil using the metric system. All soil particles have settled. This is known as the total depth. Record and label the total depth of the soil | |
| • | Shake the jar for another 5 min. Allow it to stand for 40 sec. This enables the sand to settle. Measure the depth of the settled soil using the metric system and record as sand depth | |
| • | Do not shake the jar again. Let it stand for another 30 min. Measure the depth by subtracting the sand depth to determine the silt depth | |
| • | Record and label the data. The remaining unsettled particles are clay. Calculate the clay depth by subtracting the silt and sand depth from the total depth |
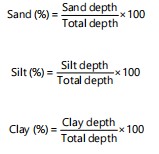
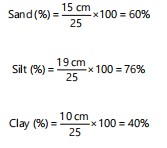
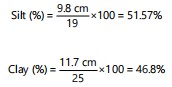
Now, calculate the percentage of each soil texture using these formulas:7
 |
RESULTS
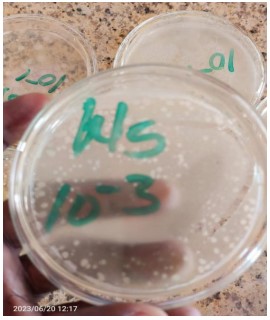
Morphological characteristics of bacterial colonies on nutrient agar: Table 1 shows the characteristics of bacterial colonies on nutrient agar of samples collected from Katagum Local Government, Bauchi State, Nigeria. Fig. 3 shows the morphological characteristics of samples A and B on the Dilution Factor. Where the bacterial isolate colour is pale, both samples A and B show pale colours. The texture of the isolate bacteria in sample A shows different textures: Mucoid, translucent, and opaque, and the texture of sample B also shows mucoid and opaque only. The isolated bacterial shapes in sample A appeared irregular. Rhizoid and irregular again. In sample B, bacterial shapes appeared in irregular, rhizoid, and filamentous shapes. Bacterial elevation in sample A is raised and flat, while in sample B, it is also raised and flat. The bacterial margin in sample A shows undulation, and in sample B, the margin also shows undulation.
| Table 1: | Morphological characteristics of bacterial colonies on nutrient agar | |||
| Sample ID | Df | Color | Texture | Shape | Elevation | Margin |
| SO-A | 10-1 | Pale | Mucoid | Irregular | Raised | Undulate |
| 10-2 | Pale | Mucoid | Rhizoid | Raised | Undulate | |
| 10-3 | Pale | Translucent | Irregular | Flat | Undulate | |
| 10-4 | Pale | Opaque | Irregular | Flat | Undulate | |
| 10-5 | Pale | Mucoid | Irregular | Raised | ||
| SO-B | 10-1 | Pale | Mucoid | Filamentous | Raised | Undulate |
| 10-2 | Pale | Opaque | Irregular | Flat | Undulate | |
| 10-3 | Pale | Mucoid | Irregular | Flat | Undulate | |
| 10-4 | Pale | Opaque | Filamentous | Flat | Undulate | |
| 10-5 | Pale | Mucoid | Rhizoid | Raised | Undulate |
|
|
| Table 2: | Morphological characteristics of bacterial colonies on differential and selective media (Gram staining) | |||
| Sample ID | Df | Gram’s reaction | Microscopic appearance |
| SO-A | 10-1 | Gram positive | Cocci in clusters |
| 10-2 | Gram negative | Rods in clusters | |
| SO-B | 10-1 | Gram positive | Diplococci |
| 10-2 | Gram positive | Cocci in clusters |
Morphological characteristics of bacterial colonies on differential and selective media, on gram staining: Table 2 shows the morphological characteristics of bacterial colonies on Differential and Selective media, and on Gram staining. In Differential media in sample A bacteria are 10-110-2 also in Sample B are 10-110-2. In the Dilution factor Gram’s reaction in sample A is both positive and negative reaction whereas sample B is positive. Microscopic appearance of the bacteria in a sample, Cocci in clusters shown in Fig. 4, and Rods in clusters shown in Fig. 5.
|
| Table 3: | Morphological characteristics of bacterial colonies on differential and selective media | |||
| Sample ID | MCA | MSA | EMB | SSA | Suspected organism |
| SO-A | No growth | Yellow mucoid | Pink mucoid | No growth | Staphylococcus aureus, |
| colonies on | colonies with | Escherichia coli | |||
| mannitol fermentation | green metallic sheen | ||||
| SO-B | No growth | Yellow mucoid | Pale mucoid | No growth | Staphylococcus aureus, |
| colonies on | colonies with a | Escherichia coli | |||
| mannitol fermentation | smooth surface |
| Table 4: | Biochemical characterization of bacterial colonies | |||
| Sample ID | CAT | COT | OXT | INT | MR | VP | Suspected organism |
| SO-A | + | + | - | - | + | - | Staphylococcus aureus, Escherichia coli |
| SO-B | + | + | + | - | - | + | Staphylococcus aureus, Escherichia coli |
Morphological characteristics of bacterial colonies on differential and selective media: Table 3 shows the morphological characteristics of bacterial colonies on differential and selective media. Samples A and B in MacConkey agar (MCA) and Salmonella-Shigella agar (SSA) yielded no growth. Whereas, in Mannitol Salt Agar (MSA), both samples A and B produce yellow mucoid colonies on mannitol fermentation. Moreover, in Eosin methylene blue agar (EMB), sample A yields pink mucoid colonies with green metallic sheen growths, whereas sample B yields pale mucoid colonies with smooth surface growths. The suspected organisms in both sample A and the bare stool were Staphylococcus aureus and E. coli.
Biochemical characterization of bacterial colonies: Table 4 shows the biochemical characteristics of bacterial colonies. Sample A shows catalase (CAT), COT test, and methyl red (MR) tests as positive, while negative reactions on oxidase (OXT), INT, and Voges-Proskauer (VP) tests are negative. Sample B yields positive results in the catalase (CAT), COT, oxidase (OXT), and Voges-Proskauer (VP) tests but negative results in the INT and MR tests. The suspected organisms, based on biochemical characteristics in both samples A and B, are Staphylococcus aureus and Escherichia coli.
RESULT OF SOIL MICRO NUTRIENTS
Micro-nutrient content of each sample: The concentration of the elements present in the sample was determined by reading their absorbance using AAS (Buck Scientific model 210GP) and comparing it to the respective standard calibration curve. Three replicate determinations were carried out on each sample.
| Table 5: | Elements present in the soil samples | |||
| Sample(mg/kg) | Cu | Fe | Mg | Zn | Na | K | Mn |
| Soil-A | 26 | 2124 | 408 | 1.1 | 30 | 379 | 370 |
| Soil-A duplicate | 27 | 2255 | 406 | 1.1 | 37 | 390 | 387 |
| Soil-B | 23 | 1489 | 392 | 1.1 | 35 | 329 | 259 |
| Soil-B duplicate | 22 | 1490 | 383 | 1 | 31 | 309 | 249 |
| Table 6: | Soil texture test by segmentation techniques | |||
| Soil percentage (%) | Soil class | pH | |||
| Sample | Clay | Silt | Sand | Soil texture | |
| Soil-A | 40 | 76 | 60 | Clay-Sandy | 6.5 |
| Soil-B | 46.8 | 51.57 | 34.21 | Clay-Loamy | 6.5 |
The metals were determined by absorption/concentration mode, and the instrument readout was recorded for each solution manually. The same analytical procedure was employed for the determination of elements in digested blank solutions and for the spiked samples.
Element present in the soil samples: Table 5 presents the concentration of essential elements (mg/kg) in two soil samples (Soil-A and Soil-B) along with their duplicates. Iron (Fe) showed the highest concentration across all samples, followed by potassium (K) and manganese (Mn) Copper (Cu), magnesium (Mg), and sodium (Na) levels varied slightly between samples, while zinc (Zn) remained consistently low at around 1.0-1.1 mg/kg. Duplicate results closely matched the original values, indicating good sample reliability.
Determination of micro nutrients contents of each sample: Concentration of the elements present in the sample was determined by reading their absorbance using AAS (Buck Scientific model 210GP) and comparing it to the respective standard calibration curve. Three replicate determinations were carried out on each sample. The metals were determined by absorption/concentration mode, and the instrument readout was recorded for each solution manually. The same analytical procedure was employed for the determination of elements in digested blank solutions and for the spiked samples.
Result for soil texture test by segmentation techniques: The soil composition percentages for clay, silt, and sand, along with pH levels, for two soil samples, where Soil A is clay sandy with 40% clay, 76% silt, and 60% sand, and Soil B is clay loamy with 46.8% clay, 51.57% silt, and 34.21% sand, both having a pH of 6.5 in
Result for soil texture test by sedimentation techniques
Sample A
 |
Sample B
 |
DISCUSSION
The practical was carried out in incredibly sterile conditions, and the suggested methodologies procedures were adhered to. Before, during, and after the analysis, safety measures were followed. To protect the vitality of the bacteria, the soil sample was taken using soil agar and examined right away. All of the laboratory equipment and reagents were sterile, and the majority of the analysis was carried out under safety conditions. Contaminants were greatly diminished as a result.
The isolated and identified bacteria were Staphylococcus aureus and Escherichia coli. The soil texture. The pH and elements present in the soil sample all influence the nutrient content of the soil7.
The pH of the soil has a significant impact on the availability of various plant nutrients. The “Ideal” pH of soil is near neutral, and neutral soils are thought to fall between a pH of 6.5, which is slightly acidic, to a pH of 7.5, which is slightly alkaline. It has been found that the majority of plant nutrients are most readily available to plants in the pH range of 6.5 to 7.5, and that plant root growth is also generally fairly compatible with this pH range. Major plant nutrients like nitrogen (N), potassium (K), and sulfur (S) seem to be less directly impacted by soil pH than many others, but they are nevertheless to some extent. However, phosphorus (P) is directly impacted. Phosphate ions typically react fast with calcium (Ca) and magnesium (Mg) to generate less soluble compounds at alkaline pH values, more than pH 7.5, for instance. Aluminum (Al) and iron (Fe) combine with phosphate ions at acidic pH levels to once again create less soluble molecules7.
The 60% sandy soil identified in this research has a more significant impact on groundnut yield. This agrees with a study conducted in Nigeria which evaluate the influence of soil textural class on the performance of groundnut cultivation which found that sandy soil have more significant infact than clay soil8. Another study conducted in Ethiopia investigates the correlation between soil properties and groundnut productivity9. The study reported that soil texture was one of the critical factors influencing groundnut yield, with soils containing more sand producing higher yields compared to those with more clay content9.
The suspected organism S. aureus and E. coli isolated in the study have an impact on groundnut yield. This correlated with one study that discusses the impact of S. aureus and E. coli on plant growth and yield10. The study investigates the relationship between soil bacterial communities and plant growth, and specifically looks at the effects of S. aureus and E. coli on these factors10. The researchers found that the presence of these bacteria can alter soil nutrient availability and enzyme activities, which in turn can affect plant growth and yield11. Relevant study on “Impact of soil microorganisms on plant growth and development” discusses the various ways in which soil microorganisms, including bacteria like S. aureus and E. coli. can influence plant growth and development10. The authors highlight that soil microorganisms can affect plant nutrient uptake, hormone production, disease resistance, and overall plant health10.
CONCLUSION
This study was conducted under strictly aseptic conditions with careful supervision and adherence to safety protocols throughout the analysis. The findings revealed that Soil A, with its higher silt (76%) and sand (60%) content, is more favorable for groundnut cultivation compared to Soil B, which contains more clay (46.8%). Although Staphylococcus aureus and Escherichia coli were isolated from the soils and may influence groundnut growth, their presence alone does not directly determine crop productivity, as multiple factors are involved. Given the benefits of sandy soils for groundnut yield, farmers in the region are advised to prioritize such soil types. Further studies should apply molecular techniques to confirm the bacterial presence. Additionally, the Ministry of Agriculture should promote awareness about these organisms, especially their potential risks through injuries sustained during fieldwork.
SIGNIFICANCE STATEMENT
This study discovered the presence of Staphylococcus aureus and Escherichia coli in groundnut farm soils, along with notable differences in soil texture, which can be beneficial for improving soil health and optimizing groundnut yield in regions like Katagum, Nigeria. By identifying key microbial communities and understanding their interaction with soil composition, this research provides essential insights into the biological and physical factors influencing agricultural productivity. The findings offer a foundation for developing targeted soil management strategies and microbial interventions to support sustainable farming practices. This study will help researchers to uncover the critical areas of soil-microbe interactions that many researchers were not able to explore. Thus, a new theory on microbially-influenced crop productivity may be arrived at.
REFERENCES
- Sender, R., S. Fuchs and R. Milo, 2016. Revised estimates for the number of human and bacteria cells in the body. PLOS Biol., 14.
- Tacconelli, E., E. Carrara, A. Savoldi, S. Harbarth and M. Mendelson et al., 2018. Discovery, research, and development of new antibiotics: The WHO priority list of antibiotic-resistant bacteria and tuberculosis. Lancet Infect. Dis., 18: 318-327.
- Salma, D., K. Venkaiah, M.V.S. Naidu and Y. Ramu, 2018. Soil physical properties and groundnut (Arachis hypogae L.) yield under long term application of manure and fertilizers under rainfed condition. Int. J. Plant Soil Sci., 22.
- Glud, R.N., F. Wenzhöfer, M. Middelboe, K. Oguri, R. Turnewitsch, D.E. Canfield and H. Kitazato, 2013. High rates of microbial carbon turnover in sediments in the deepest oceanic trench on Earth. Nat. Geosci., 6: 284-288.
- Jajere, A.I., M. Samuel, A.B. Mustapha and R.A. Mashood, 2020. Phenotypic characterization of Salmonella enterica from chickens in some selected local governments of Yobe State. Int. J. Res. Rev., 7: 76-94.
- Jajere, A.I., A.M. Jajere, M.B. Abubakar, M. Samuel, A.I. Jajere and I.M. Bammami, 2021. Antimicrobial susceptibility and minimum inhibitory concentration of Salmonella enterica isolates from chickens in Yobe State. Int. J. Microbiol. Biotechnol., 6: 104-118.
- Weil, R.R. and N.C. Brady, 2016. The Nature and Properties of Soils. 15th Edn., Pearson Education, London, England, ISBN: 9781292162249, Pages: 1104.
- Zhao, C.X., L.H. Jia, Y.F. Wang, M.L. Wang and M.E. McGiffen Jr., 2015. Effects of different soil texture on peanut growth and development. Commun. Soil Sci. Plant Anal., 46: 2249-2257.
- Zahran, H.A. and H.Z. Tawfeuk, 2019. Physicochemical properties of new peanut (Arachis hypogaea L.) varieties. OCL-Oilseeds Fats Crops Lipids, 26.
- Mendes, R., M. Kruijt, I. de Bruijn, E. Dekkers and M. van der Voort et al., 2011. Deciphering the rhizosphere microbiome for disease-suppressive bacteria. Science, 332: 1097-1100.
- Li, Y., C. Liu, J. Zhang, H. Yang and L. Xu et al., 2018. Variation in leaf chlorophyll concentration from tropical to cold-temperate forests: Association with gross primary productivity. Ecol. Indic., 85: 383-389.
How to Cite this paper?
APA-7 Style
Jajere,
A.I., Abdullahi,
S. (2025). Bacterial Isolation from Groundnut Farm Soil in Katagum, Bauchi State, Nigeria. Trends in Environmental Sciences, 1(3), 219-229. https://doi.org/10.21124/tes.2025.219.229
ACS Style
Jajere,
A.I.; Abdullahi,
S. Bacterial Isolation from Groundnut Farm Soil in Katagum, Bauchi State, Nigeria. Trends Env. Sci 2025, 1, 219-229. https://doi.org/10.21124/tes.2025.219.229
AMA Style
Jajere
AI, Abdullahi
S. Bacterial Isolation from Groundnut Farm Soil in Katagum, Bauchi State, Nigeria. Trends in Environmental Sciences. 2025; 1(3): 219-229. https://doi.org/10.21124/tes.2025.219.229
Chicago/Turabian Style
Jajere, Ahmed, Idriss, and Suleiman Abdullahi.
2025. "Bacterial Isolation from Groundnut Farm Soil in Katagum, Bauchi State, Nigeria" Trends in Environmental Sciences 1, no. 3: 219-229. https://doi.org/10.21124/tes.2025.219.229

This work is licensed under a Creative Commons Attribution 4.0 International License.