Metal Concentration in PM2.5 and PM10 and their Microbial Nature in Ambient Air of Agra, Region during Winter Season
-
Shailendra Pratap Singh
Department of Chemistry, Dr. Bhimrao Ambedkar University, Agra, Uttar Pradesh 282002, India
Ankur GuptaDepartment of Microbiology, Dr. Bhimrao Ambedkar University, Agra, Uttar Pradesh 282002, India
Tulika TripathiDepartment of Chemistry, Dr. Bhimrao Ambedkar University, Agra, Uttar Pradesh 282002, India
Ajay Taneja
Department of Chemistry, Dr. Bhimrao Ambedkar University, Agra, Uttar Pradesh 282002, India
| Received 05 Jul, 2024 |
Accepted 05 Sep, 2024 |
Published 01 Jan, 2025 |
Background and Objective: Rapid industrialization and urbanization have contaminated air in many areas of the world, either directly or indirectly. In this study particulate matter (PM2.5 and PM10), microbial and metal concentration in the ambient environment of the city of Taj, i.e., Agra is explored. Materials and Methods: Two sites were selected based on roadside and semi-urban. Sampling was conducted in the winter season. The PM2.5 and PM10 were measured by dichotomous sampler and their metals were obtained by acid extraction. Serial dilution method was used to identify the microbial activity in PM2.5 and PM10. Results: The average mass concentration of PM10 at Khandari and Trans Yamuna was found to be 232.81 and 231.85 μg/m3 and the concentration of PM2.5 was found to be 147.24 and 121.91 μg/m3, respectively during the study period. Microbial concentration revealed a high frequency of fungal contaminants in comparison to bacterial contaminants, further, Aspergillus niger and Aspergillus flavus were the most prominent fungal contaminants observed at a higher frequency, while in a few samples, gram-positive bacteria were isolated at a lower frequency. Conclusion: Heavy metal concentration for PM10 and PM2.5 was found higher at the Khandari site than Trans Yamuna site. Aspergillus flavus was the most abundant contaminant found in the highest frequency followed by Aspergillus niger, Mucor, Aspergillus fumigatus, Penicillium and Rhizopus.
| Copyright © 2025 Singh et al. This is an open-access article distributed under the Creative Commons Attribution License, which permits unrestricted use, distribution, and reproduction in any medium, provided the original work is properly cited. |
INTRODUCTION
Both developed and developing country citizens’ health conditions have gotten worse due to air pollution1. Studies conducted in the last few decades have demonstrated that ambient air pollution raises the risk of illness and death.
A class of aerosols ranging in size from 10 nm to 100 μm known as biotic components, or bioaerosol, are substances that are either alive, carry living creatures, or are expelled from living organisms (such as viruses, pollen, bacteria, fungus, cells and biofilms). Aerosol’s biotic and abiotic components contribute significantly to health issues. Modern epidemiological research has consistently and logically linked air pollution to many health outcomes, even if the biological mechanisms underlying these relationships are still poorly understood. As implied by their name, bioaerosols are derived from biological sources2. Airborne bacterial and fungal spores are mostly found on the surfaces of both living and dead plants. Microorganisms from naturally occurring water accumulations may be aerosolized by wind, waves or even rain3.
From the middle of the ocean to the middle of the Arctic, bioaerosols are found in nature everywhere. They are made up of particles like skin scales, pollen, bacterial spores, cells, viruses, protozoa and insect pieces. They consist of both coarse and fine particles. Among the tiniest bioaerosol particles are viruses, with certain species measuring only a few tens of nanometers. Pollen grains can reach diameters of more than 100μm, which is the other extreme of the size spectrum. The concentrations of bioaerosols differ greatly from place to place, just as other types of aerosols4. The biological component of ambient particulate matter might potentially have a considerable negative impact on one’s health, even though it only makes up 20% of the aerosol load5,6. These effects are compounded when chemical constituents are present. Numerous diseases are brought on by biological components, such as various microbes and fungal spores; therefore, biological characterization of the aerosol, in addition to its chemical contents, is required and is carried out in this work.
According to Haywood and Ramaswamy7 particulate matter (PM) in the atmosphere affects visibility, atmospheric chemistry, the balance of radiation on Earth and the health of all living things, including people. Globally, sulfate and carbonaceous PM are the main sources of direct radiative impacts from PM, such as PM2.5 and PM10, which are directly induced by human activity (as opposed to dust entrainment brought on by desertification)8. The health of humans is greatly endangered by these particles. Breathing particles, particularly PM2.5, which is more dangerous because they enter the lungs more deeply than PM10, can cause very serious illnesses when they reach the lungs’ alveoli. In addition to being dust, these PM particles also contain various microorganisms known as bioaerosols9.
The objective of the study was to determine ambient PM2.5 and PM10 mass concentration levels over Agra city during winter seasons. To characterize ambient PM2.5 and PM10 in terms of distinct metal content over Agra in winter seasons and to characterize and identify the bio-aerosol (microbial components) in PM2.5 and PM10 during winter seasons in ambient air of Agra region.
MATERIALS AND METHODS
Study location: Agra is situated in the North-central part (27°10'N, 78°05'E, 169 m above the mean sea level) of India. Agra is one of the most famous tourist spots in North India due to the presence of the Taj Mahal. It is a semi-arid region bounded by the desert of Rajasthan on two-thirds of its peripheries. The study was carried out during the winter season from November, 2021 to January, 2022. Temperature ranges from 9-25°C during the daytime and at night sometimes drops below 5°C. The sampling sites industrial area (Trans Yamuna) and Roadside (Khandari) were selected for the study. The descriptions of sampling sites are as follows.
Trans Yamuna (industrial area): Trans Yamuna site 27°12'26"N, 78°2'42"E, an industrial region that is located on the city’s Eastern edge. Here, industrial operations include the processing of rubber, the casting of both ferrous and non-ferrous metals, the oxidation and pulverization of lime and general engineering tasks. Coke, firewood and diesel are the fuel sources for these machines. The location is roughly 500 m from a major highway.
Khandari roadside: Semi-urban roadside areas (Khandari, Agra) 27°12'37.7"N, 77°59'24.3"E is a very busy crossing on NH-19 with residential colonies lying sideways while Kausalpur is a densely populated residential area adjacent to NH-19 with a high level of vehicular pollution, caused by the highway and localized traffic congestion.
|
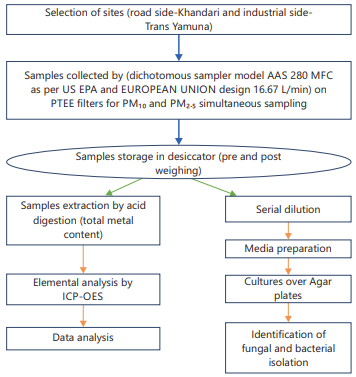
Sampling and analysis: Sampling was carried out in the winter season in Agra city at two different locations Industrial Area Trans Yamuna and Khandari roadside10. Twenty-four Particulate matter samples were collected by a Dichotomous Sampler for PM10 and PM2.5 Simultaneous Sampler using high-volume ambient air samplers operating at a flow rate of 16.67 L/min. the duration of sampling was 6-8 hrs in a day. Sampling was started at 10 in the morning till 5 in the evening. The mass of the PM10 and PM2.5 were determined by the difference in weights before and after sampling. For the analysis of metals, acid extraction was carried out11. In the acid extraction method, metals will be extracted from filter paper, which was used in an air sampler for the collection of particulate matter. The filter paper was digested in a 5-10 mL analytical grade HNO3 and HCl (1:3) in a 50 mL Erlenmeyer flask and kept on a hot plate at 40-60°C for 90 min till a clear solution was obtained. Now this clear solution is diluted up to 20 mL with distilled water and stored in the refrigerator (4°C) until analysis. The metal analysis was done by Inductive Coupled Plasma-Optical Emission Spectroscopy (ICP-OES).
For isolation and identification of microbial contamination, the filter papers were placed on nutrient agar for isolation of bacterial contaminants, while for fungal contaminants filter paper was placed on SDA broth for 24 hrs, after broth samples were streaked on nutrient agar for bacteria and on SDA agar for fungi12. Later colonies were counted to determine the microbial load and pure cultures were obtained by doing subculturing. Further pure cultures obtained were identified with lactophenol cotton blue staining for identification of fungi under a microscope (OLYMPUS, Model No. (BHS 217856) made by Japan). While gram staining was done for the identification of bacterial pure culture. The concentration of fungal and bacterial spores in the air is expressed as several colonies forming a unit per cubic meter of air (CFU/m3)13.
The concentration of fungal and bacterial spores in the air is expressed as a number of colonies forming units per cubic meter of air (CFU/m3). The sampling and analysis procedure has been presented as a flow chart in Fig. 1.
RESULTS AND DISCUSSION
Mass concentration of PM2.5 and PM10: The threshold limit of NAAQS (24 hrs average 100 and 60 μg/m3 for PM10 and PM2.5, respectively) set by the Central Pollution Control Board of India and WHO air quality guideline (annual average 50 and 25 μg/m3 for PM10 and PM2.5, respectively)21.
The results of the present study have been compared with the results obtained at the national lavel with studies done earlier which is shown in Table 1 at the national level for PM10 and PM2.5. The results found that in Chennai (292 μg/m3), Delhi (245 μg/m3), Ahmedabad (327 μg/m3), Ghaziabad (260 μg/m3) concentrations were higher for PM10, while Chandigarh (151 μg/m3), Haryana (174 μg/m3), Mumbai (61 μg/m3) and Sonipat (213 μg/m3) was lower than present study in Agra (233.15 μg/m3). Also, on comparing the mass concentrations for PM2.5, result revealed that in Amritsar (178 μg/m3), Sonipat (156 μg/m3), Delhi (145 μg/m3), Ghaziabad (140 μg/m3) concentrations were higher for PM10, while Chandigarh (112 μg/m3), Haryana (71 μg/m3), Mumbai (43 μg/m3), Ahmedabad (106 μg/m3) and Chennai (81 μg/m3) was lower than present study in Agra (146.91 μg/m3).
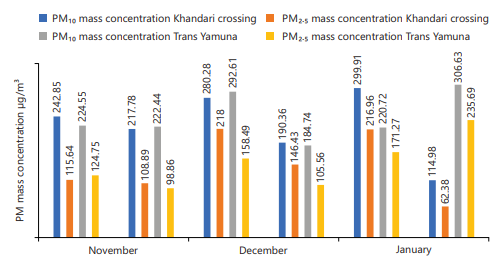
Figure 2 depicted the mass concentrations of PM10 and PM2.5 during the winter season (November-January) in Agra City at two locations, Khandari roadside and Trans Yamuna Industrial Area. The overall average mass concentration of PM2.5 at Trans Yamuna and Khandari were 149.10 and 144.71 μg/m3, respectively. The overall average mass concentration of PM10 at Trans Yamuna and Khandari were 241.94 and 224.36 μg/m3, respectively. The monthly variation in mass concentration of PM2.5 in November, December and January at Trans Yamuna were 111.80, 132.025 and 203.48 μg/m3, respectively. The monthly variation in mass concentration of PM2.5 in November, December and January at Khandari were 112.265, 182.215 and 139.67 μg/m3, respectively. The monthly variation in mass concentration of PM10 in November, December and January at Trans Yamuna were 223.496, 238.675 and 263.675 μg/m3, respectively. The monthly variation in mass concentration of PM10 in November, December and January at Khandari were 230.315, 235.32 and 207.445 μg/m3, respectively.
| Table 1: | Comparison of PM10 and PM2.5 concentration with different studies in India | |||
| Study area | PM10 (μg/m3) | PM2.5 (μg/m3) | References |
| Agra | 233.15 | 146.91 | Present study |
| Chennai | 292 | 81 | Srimuruganandam and Nagendra14 |
| Delhi | 245 | 145 | Dumka et al.15 |
| Ahmedabad | 327 | 106 | Rengarajan et al.16 |
| Amritsar | 252 | 178 | Ravindra et al.17 |
| Chandigarh | 151 | 112 | Ravindra et al.17 |
| Sonipat | 213 | 156 | Ravindra et al.17 |
| Ghaziabad | 260 | 140 | Gupta et al.18 |
| Haryana | 174 | 71 | Mor et al.19 |
| Mumbai | 61 | 43 | Kumar and Joseph20 |
|
|
|
The mass concentration of PM10 was found higher at both sites Trans Yamuna as well as Khandari roadside in January month while PM2.5 was found higher at Khandari roadside in December.
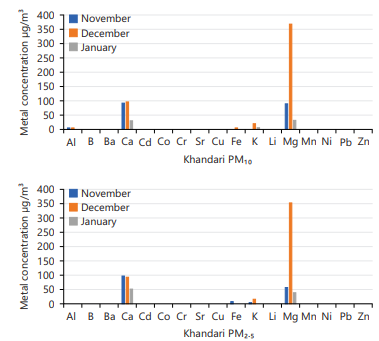
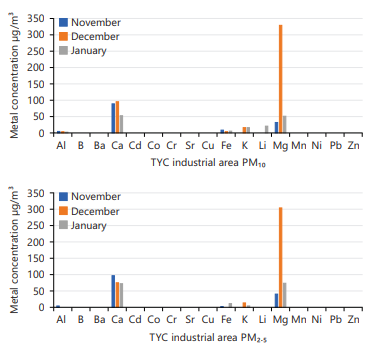
Metals concentrations: Figure 3 and 4 showed the total heavy metals concentration of PM2.5 and PM10 at Khandari and Trans Yamuna. The total metal concentration of heavy metal in this study for PM2.5 at Fungi and bacteria isolated from the air Trans Yamuna was found 245.01 μg/m3 and follows the order Mg>Ca>K>Fe>Al>Sr>Li>Pb>B> Cr>Ba>Zn>Mn>Cu>Ni>Cd>Co. The total metal concentration of heavy metal for PM2.5 at Khandari was found 250.37 μg/m3 and follows the order Mg>Ca>K>Fe>Al>Sr>Pb>B>Cr>Li>Zn>Ba>Cu>Mn> Cd>Ni>Co. In particular, for PM2.5, the concentration of Mg and Ca was found highest and Co was the lowest on both sides of Trans Yamuna and Khandari.
|
|
The total metal concentration for PM10 at Khandari and Trans Yamuna was found 252.93 and 250.70 μg/m3, respectively. At the Khandari site, heavy metal concentration for PM10 and PM2.5 was found higher than at the Trans Yamuna site.
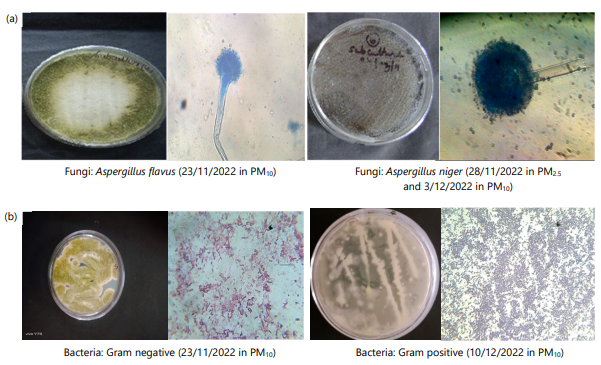
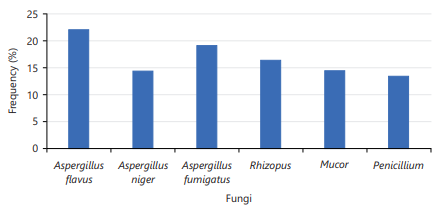
Microbial activities of PM: Collected air samples are subjected to fungal isolation, from all 24 samples collected a total of 6 fungal species were isolated and identified. They are Aspergillus flavus, Aspergillus niger, Mucor, Aspergillus fumigatus, Penicillium and Rhizopus sp. in the order of their percentage frequency as depicted in Fig. 5. The highest number of fungal colonies was reported in November and the lowest was in December. This can also be explained by moderate rainfall, medium temperature and high humidity which provides an appropriate environment for microbial growth which results in a high concentration of fungal counts. Picture 1 and 2 show fungi and bacteria isolated from the air. A total of 6 species of fungi viz., Aspergillus niger, Aspergillus flavus and A. fumigatus species and gram positive and negative were isolated from a few samples and their frequencies were given in Fig. 6.
The maximum bacterial colonies were recorded during November and December and the lowest in January.
CONCLUSION
The study concluded that the concentration of air spora was highest in October and lowest in January. Atmospheric conditions viz., temperature, relative humidity, rainfall, etc. plays a very important role. In the PM mass concentration of PM2.5 and PM10 was found higher at Trans Yamuna in January and the mass concentration of PM2.5 and PM10 was found higher at Khandari roadside in December. Heavy metal concentration for PM10 and PM2.5 was found higher at the Khandari site than Trans Yamuna site, by analyzing microbial count it can be concluded that Aspergillus flavus was most abundant contaminant found in highest frequency followed by Aspergillus niger, Mucor, Aspergillus fumigatus, Penicillium and Rhizopus. The overall air quality in the city in terms of (PM10 and PM2.5) in the PM mass concentration, metal concentration and microbial count were found to be inferior and above the standard. This study concluded that there is a need to address the issue of PM monitoring with their chemical and microbial constituents, for all the seasons so that it can be beneficial for pollution amendment policy.
SIGNIFICANCE STATEMENT
The ambient concentration of pollutants is a big problem these days worldwide. Scanty data is available in this region, particularly on bioaerosols and chemical constituents of particulate matter. The concentration of these pollutants affects human health, so it should be controlled by using low-cost interventions and environmental policies. This study will highlight the concentration of PM (PM10 and PM2.5), metal and microbiota. So that policymakers can utilize this data for suggesting and executing the plan for the city to curb air pollution. This may be further extended to other cities of developing nations.
ACKNOWLEDGMENT
I have also thanked Uttar Pradesh State Government Major Project (47/2021/606/Seventy-4-2021-4 (56)/2020) for their financial support in the research work. The authors are highly thankful to the Head of Department, Department of Chemistry, Dr. Bhimrao Ambedkar University, Agra, India for providing the necessary facilities to conduct this work.
REFERENCES
- Sharma, A.K., P. Baliyan and P. Kumar, 2018. Air pollution and public health: The challenges for Delhi, India. Rev. Environ. Health, 33: 77-86.
- Kumar, R., K.M. Kumari, V. Diwakar and J.N. Srivastava, 2012. Biochemical Characteristics of Aerosol at a Suburban Site. In: Chemistry of Phytopotentials: Health, Energy and Environmental Perspectives, Khemani, L.D., M.M. Srivastava and S. Srivastava (Eds.), Springer, Berlin, Heidelberg, ISBN: 978-3-642-23393-7, pp: 369-371.
- Miguel, A.G., G.R. Cass, M.M. Glovsky and J. Weiss, 1999. Allergens in paved road dust and airborne particles environ. Sci. Technol., 33: 4159-4168.
- Lal, H., B. Ghosh, A. Srivastava and A. Srivastava, 2017. Identification and characterization of size-segregated bioaerosols at different sites in Delhi. Aerosol Air Qual. Res., 17: 1570-1581.
- Boreson, J., A.M. Dillner and J. Peccia, 2004. Correlating bioaerosol load with PM2.5 and PM10cf concentrations: A comparison between natural desert and urban-fringe aerosols. Atmos. Environ., 38: 6029-6041.
- Viana, M., X. Querol, A. Alastuey, F. Ballester and S. Llop et al., 2008. Characterising exposure to PM aerosols for an epidemiological study. Atmos. Environ., 42: 1552-1568.
- Haywood, J.M. and V. Ramaswamy, 1998. Global sensitivity studies of the direct radiative forcing due to anthropogenic sulfate and black carbon aerosols. J. Geophys. Res., 103: 6043-6058.
- Schult, I., J. Feichter and W.F. Cooke, 1997. Effect of black carbon and sulfate aerosols on the Global Radiation Budget. J. Geophys. Res., 102: 30107-30117.
- Vinitketkumnuen, U., K. Kalayanamitra, T. Chewonarin and R. Kamens, 2002. Particulate matter, PM 10 & PM 2.5 levels, and airborne mutagenicity in Chiang Mai, Thailand. Mutat. Res. Genetic Toxicol. Environ. Mutagen., 519: 121-131.
- Varshney, P., R. Saini and A. Taneja, 2016. Trace element concentration in fine particulate matter (PM2.5) and their bioavailability in different microenvironments in Agra, India: A case study. Environ. Geochem. Health, 38: 593-605.
- Rohra, H., R. Tiwari, P. Khare and A. Taneja, 2018. Indoor-outdoor association of particulate matter and bounded elemental composition within coarse, quasi-accumulation and quasi-ultrafine ranges in residential areas of Northern India. Sci. Total Environ., 631-632: 1383-1397.
- Zaffer, M., S. Ahmad, R. Sharma, S. Mahajan, A. Gupta and R.K. Agnihotri, 2014. Antibacterial activity of bark extracts of Moringa oleifera Lam. against some selected bacteria. Pak. J. Pharm. Sci., 27: 1857-1862.
- Mamta, J.N. Shrivastava, G.P. Satsangi and R. Kumar, 2015. Assessment of bioaerosol pollution over Indo-Gangetic plain. Environ. Sci. Pollut. Res., 22: 6004-6009.
- Srimuruganandam, B. and S.M.S. Nagendra, 2010. Analysis and interpretation of particulate matter-PM10, PM2.5 and PM1 emissions from the heterogeneous traffic near an urban roadway. Atmos. Pollut. Res., 1: 184-194.
- Dumka, U.C., S. Tiwari, D.G. Kaskaoutis, V.K. Soni, P.D. Safai and S.D. Attri, 2019. Aerosol and pollutant characteristics in Delhi during a winter research campaign. Environ. Sci. Pollut. Res., 26: 3771-3794.
- Rengarajan, R., A.K. Sudheer and M.M. Sarin, 2011. Wintertime PM2.5 and PM10 carbonaceous and inorganic constituents from urban site in Western India. Atmos. Res., 102: 420-431.
- Ravindra, K., T. Singh, S. Mor, V. Singh and T.K. Mandal et al., 2019. Real-time monitoring of air pollutants in seven cities of North India during crop residue burning and their relationship with meteorology and transboundary movement of air. Sci. Total Environ., 690: 717-729.
- Gupta, L., R. Dev, K. Zaidi, R.S. Raman, G. Habib and B. Ghosh, 2021. Assessment of PM10 and PM2.5 over Ghaziabad, an industrial city in the Indo-Gangetic Plain: Spatio-temporal variability and associated health effects. Environ. Monit. Assess., 193.
- Mor, S., T. Singh, N.R. Bishnoi, S. Bhukal and K. Ravindra, 2022. Understanding seasonal variation in ambient air quality and its relationship with crop residue burning activities in an agrarian state of India. Environ. Sci. Pollut. Res., 29: 4145-4158.
- Kumar, R. and A.E. Joseph, 2006. Air pollution concentrations of PM2.5, PM10 and NO2 at ambient and kerbsite and their correlation in Metro City-Mumbai. Environ. Monit. Assess., 119: 191-199.
- Pandey, P., A.H. Khan, A.K. Verma, K.A. Singh, N. Mathur, G.C. Kisku and S.C. Barman, 2012. Seasonal trends of PM2.5 and PM10 in ambient air and their correlation in ambient air of Lucknow City, India. Bull. Environ. Contam. Toxicol., 88: 265-270.
How to Cite this paper?
APA-7 Style
Singh,
S.P., Gupta,
A., Tripathi,
T., Taneja,
A. (2025). Metal Concentration in PM2.5 and PM10 and their Microbial Nature in Ambient Air of Agra, Region during Winter Season. Trends in Environmental Sciences, 1(1), 8-15. https://doi.org/10.21124/tes.2025.08.15
ACS Style
Singh,
S.P.; Gupta,
A.; Tripathi,
T.; Taneja,
A. Metal Concentration in PM2.5 and PM10 and their Microbial Nature in Ambient Air of Agra, Region during Winter Season. Trends Env. Sci 2025, 1, 8-15. https://doi.org/10.21124/tes.2025.08.15
AMA Style
Singh
SP, Gupta
A, Tripathi
T, Taneja
A. Metal Concentration in PM2.5 and PM10 and their Microbial Nature in Ambient Air of Agra, Region during Winter Season. Trends in Environmental Sciences. 2025; 1(1): 8-15. https://doi.org/10.21124/tes.2025.08.15
Chicago/Turabian Style
Singh, Shailendra, Pratap, Ankur Gupta, Tulika Tripathi, and Ajay Taneja.
2025. "Metal Concentration in PM2.5 and PM10 and their Microbial Nature in Ambient Air of Agra, Region during Winter Season" Trends in Environmental Sciences 1, no. 1: 8-15. https://doi.org/10.21124/tes.2025.08.15

This work is licensed under a Creative Commons Attribution 4.0 International License.