Assessment of Impact of Land-Use Activities at the Watershed of Njaba River Imo State Using GIS and Remote Sensing Technology
-
Sylvanus Iro


Department of Geography and Environmental Management, Imo State University Owerri, Nigeria
| Received 10 Jul, 2024 |
Accepted 17 Sep, 2024 |
Published 01 Jan, 2025 |
Background and Objective: The Njaba River watershed in Imo State, South-East Nigeria, has experienced significant environmental degradation due to various land-use activities. This study aims to evaluate the impact of these activities on the watershed using GIS and remote sensing technology. The objective is to classify land-use and land-cover types to understand the extent of human-induced changes and to recommend sustainable land-use practices. Materials and Methods: Satellite imagery from the Landsat 11 mission was utilized for this study. The analysis was conducted using ArcGIS 10.8 software. The classification process involved creating training areas and signature files and classifying the imagery into five categories: Vegetation, agriculture, waterbodies, urban lands and open/gully lands. Data were collected through reconnaissance surveys and image classification to quantify the land-use changes over time. Results: The study revealed significant degradation of the Njaba River watershed due to human activities such as deforestation, unregulated sand mining and waste disposal. Vegetation covers 62% of the watershed, while urban land comprises 28%, agriculture 1%, waterbodies 5% and open/gully land 4%. The reduction in vegetation and the increase in urban areas highlight the adverse impact of human activities on the watershed. Eutrophication, caused by waste dumping, has further degraded the river's quality. Conclusion: Effective watershed management strategies are urgently needed to mitigate the adverse effects of human activities, through legislation, education and sustainable practices. Transforming the watershed into a protected area can restore ecological balance and enhance tourist potential.
| Copyright © 2025 Sylvanus Iro. This is an open-access article distributed under the Creative Commons Attribution License, which permits unrestricted use, distribution, and reproduction in any medium, provided the original work is properly cited. |
INTRODUCTION
Iro1 highlights that global environmental issues like climate change, terrorism and unsustainable development are increasingly critical challenges for the future of our planet and humanity. Hunt2 noted that watershed management is frequently applied in urban areas dependent on water sources to safeguard drainage basins from degradation and pollution. However, despite being a natural habitat for biodiversity and a potential tourist attraction, watersheds are experiencing serious stress due to years of socio-economic exploitation. This includes rampant deforestation, unregulated sand mining, construction and waste dumping-all of which have resulted in widespread vegetation loss and erosion of topsoil, ultimately leading to the deposition of eroded materials into watershed1.
To restore the watershed, it is crucial to study its degradation. This requires assessing the impact of land-use activities in the area, which involves using remote sensing technology to classify the land-use and land-cover types of the Njaba River watershed. This classification helps understand how societal activities have negatively impacted the watershed and aids in identifying sustainable land-use options3. For a modern nation to make informed decisions, it must access comprehensive information on various complex, interrelated aspects of its activities4. While land use is just one aspect, understanding land use and land cover has become increasingly important for addressing issues such as uncontrolled development, deteriorating environmental quality, loss of prime agricultural lands, destruction of watersheds and important wetlands and loss of fish and wildlife habitats5. Land use data are essential for analyzing environmental processes and problems that must be understood to improve or maintain living conditions and standards6. The Njaba watershed is highly susceptible to floods, with their intensity becoming increasingly alarming. This region is not immune to the effects of such extreme events. The vulnerability is exacerbated by rapid population growth, uncontrolled land use, human activities and the natural characteristics of the environment7. The impact of human activities in the urban, municipal and populated areas makes surface water bodies like streams, rivers, lagoons, etc. and groundwater bodies to be susceptible to contamination from pollutants. Pollution of soil and water by heavy metal occurs due to industrial wastes, fertilizer application, sheeting corrosion, wires, pipes and burning of coal and wood8.
The management of waste in communities surrounding the river is lacking, leading to increased pollution within the river. Additionally, sand mines along the river have resulted in gully erosion throughout the watershed. These changes in land use and land cover have had severe consequences, including siltation of the river source, increased risk of gully erosion and devastating flooding. In light of these challenges, it is essential to utilize technology for accurate mapping of the river's watershed to identify potential solutions.
The Njaba River has long been a vital water source for the surrounding communities. Unfortunately, human activities have led to changes in the Njaba watershed over time. Agricultural activities, sand mining and building construction are among the factors contributing to the degradation of the watershed. This degradation has had a significant impact on the river's water capacity. To better understand the extent of this issue, research will be conducted to quantify the level of degradation. The latest Landsat satellite imagery, with a resolution of 30 m, will be used to classify and quantify the different parts of the watershed. This research aims to identify the most stressed areas of the watershed.
MATERIALS AND METHODS
Study area: The Njaba is one of the local government areas in Imo State, Nigeria. The headquarters are located in the town of Nnenasa. As of the 2006 census8, it has an area of 84 km2 and a population of 143,485. The projected population density for 2011 is 2,004.5 people/km2. The Njaba was formed from Njaba River. The Njaba River originates from the town of Isu Njaba in the Northwest. It flows to Oguta and finally settles into the famous Oguta Lake. The following are the towns that makeup Njaba: Umaka, Achara, Amafor, Amaini, Ibele, Amakolu, Ishioji, Obeakpu, Uba, Umere, Ukwudor, Abaz, Umuawi, Umudiroga, Umuelem, Umuneke, Umuofeke, Umuokwara, Umuseke, Amucha., Agwa, Duriaku, Druuelu, Druigwe, Ebeasa, Ibeisu, Ejiene, Umuduruoka, Umundo, Umundu, Umuokpoko, Umuoma, Umuorji, Umujikeabum, Atta, Egwedu, Ejiuba, Ishekwe, Ohima, Ubokoro, Ubudum, Ugbele, Umuelim, Umumanu, Umunam and Umuoke. The Njaba Local Government Area is surrounded by Oru-East LGA, Isu, Mbaitolu, Orlu and Nkwere Local Government Areas. The Njaba LGA is located to the east of Oru East Local Government Area of Awo Omamma, which is the nearest border with Okwudor.
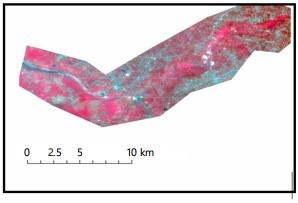
Njaba River: The Njaba River as shown in Fig. 1, originating from the North-Western part of Isu at Isunjaba, flows Southwest through the Njaba and Oguta territories towards Oguta Lake, passing through the Southern parts of Ukworji Umunnoha and Oguta Local Government Areas. Other significant rivers in Imo State include the Imo River. Over the years, the Njaba River has experienced extensive sand extraction, leading to severe bank erosion and the formation of gullies. This illegal sand mining is carried out by local villagers, often unaware of the environmental impact, who sell the river sand for construction and other purposes. The business has expanded, attracting participants from other towns and villages. Consequently, a large crater, measuring over 5 km deep, has formed along the river banks. Residents are increasingly concerned about this situation, as flooding frequently results in fatalities. Despite this, local and state government authorities have largely ignored the issue, possibly because they also benefit.
|
Climate: The climate of Njaba is shaped by the interaction of various elements of the atmosphere which comprise temperature, precipitation, humidity and evapotranspiration6. Rainfall is the greatest climate variable with far-reaching effects in Imo State due to its seasonal nature. Its intensity, duration and amount determine the rates of groundwater recharge, soil moisture, leaching, water logging, surface runoff, soil erosion and other outdoor activities, Njaba experiences eight months of the wet season starting, from March to October with an annual total mean of 2190 mm, the dry season lasts about four months from November to February which may experience minimal showers9. The temperature of Njaba is determined by its latitudinal location in the tropics, hence it receives abundant sunshine and heat, the mean monthly temperature for the dry season is 34 and 30°C for the rainy sea10.
Relative humidity of Njaba as measured with the wet and dry bulb hygrometer an annual maximal of 70% which occurs in May/June and shows the September/October period while the lowest is 60% occurring between November and March, it is noteworthy that during the "Harmattan Spell" between January and February, a few days of extremely low humidity of 20 to 40% may occur. The rate of evaporation as measured by the amount of potential evapotranspiration is 1450 mm/year (Min of Lands, Survey and Urban Development).
Soil: As regards the report by the Ministry of Lands, Survey and Urban Development, the soil properties in the study area indicate that the top 60-80 cm layer has a sandy loam to loamy sand texture with a brownish-red hue. Additionally, the soil features high porosity, a weak structure that is easily crumbled and a fast percolation rate. Based on the classification criteria set by the United States Department of Agriculture and the Food and Agricultural Organization of the United Nations, these soil properties are classified as “ferralitic soils”11.
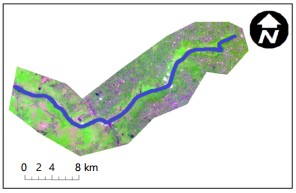
Methodology: This study was carried out between January to May, 2024. Materials used for the study include a Landsat satellite image with a pixel value of 30 m resolution Fig. 2, a street guide of Njaba L.G.A with a scale of 1:20,000 m and published by Imo state survey department in 1985, reconnaissance survey carried out on the study area.
|
| Table 1: | Land-use classification scheme1 | |||
| Description of the land use/land cover | Land use/land cover categories |
| Water | Dam, rivers streams |
| Vegetation | Forest, primary and secondary vegetation |
| Agriculture | Shrubs, plantations and cropped-land |
| Rock/urban lands | Roads, buildings and open spaces |
| Open lands | Gullies, sheet and rill erosion |
Software used includes ArcGIS 10.2 for image classification and GPS to pick the coordinates of the study area. Supervised classification is much more accurate for mapping classes, but depends heavily on the cognition and skills of the image specialist8. The strategy is simple, the specialist must recognize conventional classes (real and familiar) or meaningful (but somewhat artificial) classes in a scene from prior knowledge, such as personal experience with the region, experience with thematic maps or on-site visits11 This familiarity allows the specialist to choose and set up discrete classes (thus supervising the selection) and the assigned category. Based on the knowledge of the study area, reconnaissance survey and additional information from previous studies in the area, a classification scheme was developed5. The scheme gives a broad classification where each of the land use/land cover was identified as described in Table 1.
Method of data collection: In ArcGIS, image classification involves a process of creating training areas, signature files and classifying imagery. To add a Landsat satellite image in the ArcMap environment, follow these steps:
| • | Open the image classification Toolbar and ensure the satellite imagery is selected in the layer drop-down menu | |
| • | Open the simple manager and click on the "draw polygon" icon to start selecting the training areas | |
| • | Draw polygons on areas with known land-use purposes | |
| • | Identify the following classes: (1) Vegetation, (2) Agriculture, (3) Waterbodies, (4) Urban-lands and (5) Open/gully land | |
| • | Draw polygons on the land-cover types identified. For example, a waterbody class polygon should be drawn or chosen in multiple training sites to ensure that the training areas are selected across the image | |
| • | After selecting multiple training areas for each water class, highlight each row in the training sample manager and click on the merge tool to merge the entire water polygon into one class. Training areas for other classes can be created using the same method |
RESULTS
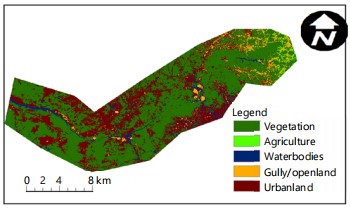
Data presentation and analysis: In this study, remote sensing and GIS methodologies were utilized to analyze satellite images. This included an investigation of the study area, DEM analysis and an evaluation of the impact of land use. In presenting the data, the satellite image was utilized to detect and quantify the impact of land use activities, such as observing water, open land and vegetation (Fig. 3). By leveraging GIS and remote sensing, changes over time can be easily tracked using this method.
Data analysis: This study aims to assess the impact of human activities on the Njaba watershed area, which has resulted in significant degradation of the watershed and pollution of the river. According to Iro et al.5, the term watershed refers to a ridge that separates areas drained by different river systems. A catchment basin is a geographical area that drains into a river or reservoir. This analysis indicates that the entire river has been severely impacted, with only 5% of the water remaining and a pixel count of 11483 m2. Vegetation covers approximately 62% of the area with a pixel count of 141356 m2, while agriculture only accounts for 1% with a pixel count of 2350 m2. Gully/Openland covers 4% with a pixel count of 9458 m2 and urban lands makeup around 28% of the area with a pixel count of 63775 m2 as described in Table 2.
DISCUSSION
Impact of land-use activities on the watershed: The findings from Table 2 reveal an alarming trend of urban encroachment and Gully/Openland in the entire watershed area, accounting for 28 and 4% of the land, respectively. A study conducted by Ezezika and Adetona6 showed that urban land occupied 22% of the watershed and just 9 years later, it has risen to 28%, a 6% increase. According to Simon and Collison11 urbanland involves the removal of trees and vegetation, changes in land use due to infrastructure development and redirection of surface runoff through storm sewers and retention basins. These changes can be attributed to residents seeking proximity to the river for water access, fertile land for agriculture and fishing, income and raw materials. Other factors such as sea breeze and flat land contribute to this trend, which has resulted in a stressed and polluted watershed, with even the agricultural areas making way for urban development5. Agriculture has a percentage of about 1% which shows neglect for agriculture around the area which is being replaced by sand mines, logging activities and other commercial activities. These activities contribute to creating gully in the watershed which constitutes 4% of the entire watershed. This is as a result of erosion going on around the area. When development and urbanization put stresses on natural stream systems, erosion can accelerate beyond the norm. This leads to decreased bank stability, a diminished capacity to handle flood waters and excess sediment clouding of the stream. Vegetation occupies 62% of the watershed which is the highest amongst all the classes. The reason for this is that since there is a presence of water plants tend to survive more. The presence of vegetation along the watershed has some advantages according to Simon and Collison11. Vegetation in watersheds plays a crucial role in maintaining water quality. The primary plant cover consists of grasses, shrubs and trees. As these plants fall and decompose, they contribute organic matter to the soil. Trees, in particular, are vital for watershed protection. Tree litter safeguards the soil surface, while tree roots prevent erosion. Additionally, trees provide a canopy that keeps the water cool, preventing thermal pollution that could harm aquatic organisms. This canopy also diminishes the impact of rain and reduces wind velocity within the watershed. Plant cover is essential for preventing soil erosion as water flows downstream and it also offers food and shelter for many small organisms. However, increasing human activities around the watershed are reducing the size of the waterbody, which now constitutes just 5% of the total watershed area.
| Table 2: | Percentage of landuse/cover classes | |||
| Class | Pixel count | Percentage |
| Vegetation | 141356 | 62 |
| Agriculture | 2350 | 1 |
| Waterbodies | 11483 | 5 |
| Gully/Openland | 9458 | 4 |
| Urbanland | 63775 | 28 |
|
Factors responsible for the degradation of the watershed: Based on research findings, it is evident that the Njaba watershed has undergone significant stress and degradation. As an illustration, the study noted that the watershed has experienced widespread degradation resulting in eutrophication due to rapid urbanization and indiscriminate waste dumping8. The buildup of urban lands in both the upper and lower sections of the river has led to waste discharge into the river, causing eutrophication in the lower sections. Essentially, eutrophication refers to an increase in the organic matter supply rate within an ecosystem. This phenomenon occurs along the watercourse, possibly due to residents dumping their waste in and around the watershed, which slows the river’s movement and could cause flooding during the rainy season.
Presence of commercial activities: The commercial activities like block industry, food vendors and wood logging which are located along the watershed play a huge role in the eutrophication of the watershed. Block industry set up their factory there because of the presence of water and the chemicals from the cement (which contains harmful substances) used for production of these blocks flow back into the river during flooding activities.
Presence of agricultural activities: The presence of fertilizers, both organic and inorganic, in the river during the rainy season may be contributing to the growth of eutrophication along the two rivers. This decrease in necessary nutrients for aquatic organisms has led to a reduction in fish and other aquatic life. Additionally, the construction of buildings, roads and parks by residents around the watershed has destroyed the once-beautiful scenery. This has caused the river to change course and meander, potentially due to deposition.
The findings indicated that the degradation observed at the watershed was directly linked to human activities that negatively impacted the river. The study also revealed that human impact was the primary cause of environmental degradation in and around the river's watershed. While watersheds have a natural ability to cleanse themselves through filtering, they can become polluted when industrial or municipal waste is discharged into them, leading to point source pollution that overloads the system and increases pollution. Nonpoint source pollution, which is contributed to by many sources, can also, accumulate and cause significant damage. The research found that vegetation occupied 62% of the watershed, while waterbodies, agriculture and urban land occupied 5, 1 and 4%, respectively. This poses a danger to aquatic and terrestrial life that depend on the river as a water source. The health of our environment is reflected in the state of our watersheds. Urban and suburban development can substantially affect natural watershed conditions by changing the terrain, altering vegetation and soil properties and adding pavement, buildings, drainage systems and flood control infrastructure. These developments lead to hydrologic and geomorphic impacts, primarily due to the increase in impervious surfaces associated with urbanization6.
CONCLUSION AND RECOMMENDATIONS
The Njaba watershed is deteriorating due to urban development and human activities, leading to pollution and eutrophication. If left unchecked, the river may run dry, causing harm to humans and aquatic life. Collaboration between government, NGOs and residents is crucial to protect the watershed. Buffering the watershed for vegetation regeneration can help recharge the water table and reduce eutrophication. Afforestation campaigns and halting agricultural activities can also improve biodiversity and revitalize aquatic life. Government laws and regulations can prevent harmful activities and protect the river.
SIGNIFICANCE STATEMENT
This study used GIS and remote sensing to evaluate the impact of land-use activities on the Njaba River watershed in Imo State, Nigeria. The objective was to classify land-use and land-cover types to understand human-induced changes and recommend sustainable practices. The study revealed significant degradation due to deforestation, unregulated sand mining and waste disposal. Vegetation dominates the watershed, followed by urban land, agriculture, waterbodies and open/gully land. The findings highlight the need for effective watershed management strategies, including legislation, environmental education and promoting afforestation and sustainable land-use practices. Future research should focus on monitoring and exploring additional technological solutions.
REFERENCES
- Iro, S., 2020. Land-cover removal and gully development in Southeast Nigeria: A 30-year analysis with pixel and OBIA approaches in juxtaposition. Am. J. Environ. Sci., 16: 34-47.
- Hunt, J.C.R., 2005. Inland and coastal flooding: Developments in prediction and prevention. Phil. Trans. R. Soc. A., 363.
- Eiser, J.R., A. Bostrom, I. Burton, D.M. Johnston and J. McClure et al., 2012. Risk interpretation and action: A conceptual framework for responses to natural hazards. Int. J. Disaster Risk Reduct., 1: 5-16.
- Echendu A.J., 2020. The impact of flooding on Nigeria’s sustainable development goals (SDGs). Ecosyst. Health Sustainability, 6.
- Iro, S.I., P.N. Duru and C.A. Achalonu, 2022. The use of remote sensing and GIS methodology in the analysis of Urualla Gully Erosion Site Imo State Nigeria. J. Environ. Sci. Curr. Res., 5.
- Ezezika, O.C. and O. Adetona, 2011. Resolving the gully erosion problem in Southeastern Nigeria: Innovation through public awareness and community-based approaches. J. Soil Sci. Environ. Manage., 2: 286-291.
- Chinwendu, O.G., S.O.E. Sadiku, A.O. Okhimamhe and J. Eichie, 2017. Households vulnerability and adaptation to climate variability induced water stress on downstream Kaduna River Basin. Am. J. Clim. Change, 6: 247-267.
- Onyekuru, S.O., H.O. Nwankwoala and I. Uzor, 2017. Heavy metal analysis of Otamiri River in Imo State, South-Eastern Nigeria. Biodiversity Int. J., 1: 172-175.
- Osibanjo, O., A.P. Daso and A.M. Gbadebo, 2011. The impact of industries on surface water quality of River Ona and River Alaro in Oluyole Industrial Estate, Ibadan, Nigeria. Afr. J. Biotechnol., 10: 696-702.
- Argaz, A., B. Ouahman, A. Darkaoui, H. Bikhtar, E. Ayouch and R. Lazaar, 2019. Flood hazard mapping using remote sensing and GIS tools: A case study of Souss Watershed. J. Mater. Environ. Sci., 10: 170-181.
- Simon, A. and A.J.C. Collison, 2002. Quantifying the mechanical and hydrologic effects of riparian vegetation on streambank stability. Earth Surf. Process Landforms, 27: 527-546.
How to Cite this paper?
APA-7 Style
Iro,
S. (2025). Assessment of Impact of Land-Use Activities at the Watershed of Njaba River Imo State Using GIS and Remote Sensing Technology. Trends in Environmental Sciences, 1(1), 16-22. https://doi.org/10.21124/tes.2025.16.22
ACS Style
Iro,
S. Assessment of Impact of Land-Use Activities at the Watershed of Njaba River Imo State Using GIS and Remote Sensing Technology. Trends Env. Sci 2025, 1, 16-22. https://doi.org/10.21124/tes.2025.16.22
AMA Style
Iro
S. Assessment of Impact of Land-Use Activities at the Watershed of Njaba River Imo State Using GIS and Remote Sensing Technology. Trends in Environmental Sciences. 2025; 1(1): 16-22. https://doi.org/10.21124/tes.2025.16.22
Chicago/Turabian Style
Iro, Sylvanus.
2025. "Assessment of Impact of Land-Use Activities at the Watershed of Njaba River Imo State Using GIS and Remote Sensing Technology" Trends in Environmental Sciences 1, no. 1: 16-22. https://doi.org/10.21124/tes.2025.16.22

This work is licensed under a Creative Commons Attribution 4.0 International License.