Species Diversity and Carbon Accumulation of Two Golf Courses in Makurdi, Benue State
-
Thomas Okoh
Joseph Sarwuan Tarka University, Makurdi, P.M.B 2373, Benue State, Nigeria
Onyinyechi Priscilla Okpara

Joseph Sarwuan Tarka University, Makurdi, P.M.B 2373, Benue State, Nigeria
Daniel NoahJoseph Sarwuan Tarka University, Makurdi, P.M.B 2373, Benue State, Nigeria
| Received 29 Jul, 2025 |
Accepted 01 Sep, 2025 |
Published 30 Sep, 2025 |
Background and Objective: There is an increasing trend in anthropogenic activities in the destruction of natural habitats of plants and less awareness of conservation measures, including the consequence of actions on the ecosystems. A survey was conducted to investigate the species diversity and carbon stock potential of trees, herbs, and soil at NASME and New Bridge Golf Course, Makurdi, Benue State. Materials and Methods: Each Golf course was divided into two plots of 100×100 m, and each plot had three quadrats was resulting in a total of twelve quadrats for both Golf courses. The biomass and carbon stock of 50 dominant trees and shrubs, 12 species of trees, and 78 species of herbs from 28 families were evaluated. Above and below ground trees and shrubs’ biomass was determined using allometric equations, and herbs and grasses biomass was estimated using the stable oven dry weight method. Results: Parkia biglobosa had the highest SCO2E (7655.17 kg) and TSC/Tree (2085.88 kg) in both study locations. Parkia biglobosa also had the highest record in above-ground (5348.40 kg) and below-ground (3476.46 kg) biomass, lowest above-ground biomass recorded in Polyanthia longifolia and Tectona grandis(71.74 kg). Diversity index (Shannon-Weiner) (2.15), species evenness (0.93), and richness (10.00) were evaluated highest in the NASME Golf course. Vernonia cinerea had the highest relative frequency (0.122), relative density (12.25), relative abundance (0.061), and IVI (12.44). The FVI was highest in Cyperaceae (24.27) and least in Cucurbitaceae (0.2) at the NASME golf course. Mitracarpus villosus had the highest relative frequency (0.127), relative density (12.72), relative abundance (0.06), and IVI (12.91), while Poaceae had the highest FVI (26.22). Conclusion: In both study sites, the total number of trees, herbs, and soil collected demonstrates that there are differences in carbon stock in both sampled sites based on the degree of disturbance.
| Copyright © 2025 Okoh et al. This is an open-access article distributed under the Creative Commons Attribution License, which permits unrestricted use, distribution, and reproduction in any medium, provided the original work is properly cited. |
INTRODUCTION
Species diversity and carbon accumulation are two important components of ecosystem functioning1. Species diversity refers to the number and variety of species found in a particular ecosystem, while carbon accumulation refers to the amount of carbon stored in the ecosystem. The relationship between these two components has been extensively studied as they both contribute to the overall health of the ecosystem and have important implications for global carbon cycles. Higher species diversity is positively correlated with ecosystem stability and resilience, as well as higher rates of primary productivity2. Carbon accumulation in an ecosystem provides important benefits such as carbon sequestration, which contributes to climate change mitigation. In recent research of tropical forests, high species diversity was found to be positively associated with higher levels of above-ground carbon storage3. Another study found that communities with higher tree species diversity were associated with higher carbon storage in both aboveground and belowground biomass4.
The relationship between species diversity and carbon accumulation highlights the importance of protecting biodiversity in order to address climate change. By protecting and restoring natural ecosystems, we can simultaneously maintain and increase biodiversity as well as contribute to carbon sequestration. This can be facilitated through sustainable land management practices, as well as conservation and restoration efforts5. Trees are arguably the most efficient sequester of carbon6. During photosynthesis, trees absorb carbon dioxide from the atmosphere and convert it into carbohydrates for energy. The remaining carbon is stored in the wood and bark of the tree. Growing more trees, particularly indigenous species, in an area is one of the most effective ways of sequestering large amounts of carbon in an ecosystem.
Grasses also play a vital role in sequestering carbon, although on a smaller scale than trees. Grasses absorb carbon dioxide through photosynthesis and use it to form glucose and other organic molecules7. The glucose is used for energy production, and some of the carbon is stored in the root and leaf tissues. Planting or restoring grasslands can be an effective method for increasing carbon sequestration, especially in the guinea savanna region, where Benue State belongs.
Soil is another major sink for atmospheric carbon dioxide. This happens during microbial respiration, soil microorganisms break down plant material, releasing the stored carbon dioxide in the form of carbonic acid. This dissolves in water and is absorbed by minerals or used by plants, storing the carbon in the soil8. Carbon enhances soil health, and introducing new crop varieties that aid in carbon sequestration can help increase the amount of carbon stored in this manner9. All trees, grasses, and soils have their natural mechanisms for sequestering carbon dioxide from the atmosphere and mitigating the effects of climate change. Uptake of carbon dioxide through these methods is crucial for reducing global warming. Achievement of full carbon mitigation potential requires estimation of country-level carbon stocks through statistically validated methods10.
Carbon sequestration is the process of reducing carbon from the atmosphere and depositing it in reservoirs11. Carbon sequestration by plants, particularly in the terrestrial ecosystems, entails the absorption of carbon dioxide from the atmosphere during photosynthesis12. The carbon dioxide obtained is converted to biomass, consequently reducing atmospheric carbon and storing it in plant tissues above and below ground. Forest ecosystems play an important role in the sustenance of the total global carbon bank and cycle, as they are reported to sequester about 80% to 40% of terrestrial organic carbon13.
The build-up of carbon dioxide and other greenhouse gases in the atmosphere captures heat and consequently results in climate change implications14. The evaluation of strategies for mitigation of climate change impacts through investigations on how carbon can be captured is a significant step towards defying the consequences of global warming15. This research is particularly relevant since there is an increasing trend of anthropogenic activities in the destruction of natural habitats of plants and less awareness of conservation measures, including the consequences of actions on the ecosystems. The quantification of carbon sequestered in a particular ecosystem or region will assist policy makers, researchers, and entrepreneurs to advocate for emission reduction, especially from developed nations16.
Carbon uptake estimation, afforestation, and grazing exclusion support the reduction of carbon escape to the atmosphere and favour carbon sequestration through reduction of organic carbon deposition and soil erosion in the presence of higher ground cover17.
This study was based on tree species diversity, herbs and grasses biomass, and also the soil organic carbon, on two Makurdi golf courses (NASME golf course and the New Bridge golf course).
The specific objectives in this study include:
| • | Estimation of the dry and wet biomass of grasses, herbs, and shrubs in the two golf courses studied | |
| • | Evaluation of species diversity indices, abundance, percentage frequency, and important value indices of species in the study location |
MATERIALS AND METHODS
Study area: The research was conducted in two golf courses: NASME golf course and the New Bridge golf course, court 5 located in Makurdi. Makurdi town is the headquarters of Makurdi Local Government Area and the capital of Benue State. The town is located between Latitude 7°38'-7°50'N, and Longitude 8°24' and 8°38'E18. It is situated in the Benue valley in the North Central Region of Nigeria. Located in Central Nigeria and is part of the middle belt region of Central Nigeria. The city is situated on the South bank of the Benue River. It is traversed by the second-largest river in the country, the Benue River.
Data collection methods
Description: Data was collected from Makurdi golf course, which includes: Sappers golf course, NASME, and The Makurdi golf course, new bridge, court 5. Each Golf course was divided into two plots of 100×100 m, and each plot, three quadrats was thrown for each plot, having a total of twelve quadrats for both Golf courses.
Tree species: The data collection on woody vegetation, herbs, grasses, and soil samples was carried out between the 13-20th of December, 2022. Trees measuring greater than or equal to 15 cm in diameter at breast height (DBH), using the Girth diameter (measuring tape). Tree height was taken with the Haga Altimeter. The canopy diameter was also taken using the 30 cm measuring tape. The biomass and carbon stock of dominant trees and shrubs were estimated using allometric equations developed for tree and shrub species19.
Herbaceous and grasses biomass: A destructive sampling method was used for measuring the biomass of grasses and herbs by harvesting whole parts of fresh samples of grasses or herbs within each quadrat, a size of 1×1 m, using a cutlass or sickle. All grasses emerging within the quadrat’s areas were cut at the ground level, weighed, and a composite sample was obtained for oven-dry mass determination. The oven drying was set and observed for 24 hrs or until the samples reached their stable weight20.
Soil organic carbon stock: Soil samples were collected in each quadrat along the transect line at a soil depth of 10 cm from the centre of each quadrat for soil bulk density (SBD) determination. A total of 12 soil samples were collected from both fields and taken to the laboratory for oven drying to get the soil organic carbon21.
Data analysis: The data that was obtained study locations were analysed using the Statistical Package for the social Sciences (IBM SPSS Statistics 25).
The Shannon-Weiner diversity index, which specifies the comparative occurrence of many species’ abundance and relative richness amongst species22.
Species richness, evenness, and diversity were taken. Species richness is simply the number of species present in an area23. Species evenness refers to the proportion that each species comprises of the whole24. The Shannon-Weiner species diversity index is calculated by taking the number of each species, the proportion each species is of the total number of individuals, and summing the proportion times the natural log of the proportion for each species. Since this is a negative number, we then take the negative of the negative of this sum. The higher the number, the higher the species diversity. In the ideal situation, one should compare populations that are the same size in numbers of individuals Pielou24 and Goswami et al.25. The formula is as follows:
where, H’ is the species diversity index, s is the number of species, and pi is the proportion of individuals of each species belonging to the ith species of the total number of individuals.
The cover value indices (CVI) were used for evaluating. The CVI was calculated by adding the relative density (RDe) and relative dominance (RDo) of species26. The importance value index (IVI) was calculated by adding CVI and relative frequency (RF)27:
CVI = RDe+RDo |
IVI = CVI+RF |
RF, RDe and RDo were obtained using the following equations:
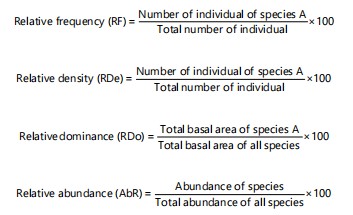 |
Family value index (FVI) = Sum of IVI of all species in each family.
Measurement of tree height and Diameter at Breast Height (DBH): Tree height was measured using a Haga altimeter; height classes range from 0-5, 6-10, 11-15, and 16-20. While DBH (cm) was measured using a measuring tape at approximately 1.3 m above ground on each tree, and it ranged from 0-50, 51-100, 101-150, 151-20028.
Biomass determination: Data was collected on plant height (m), Diameter at Breast Height (DBH, cm), while species above-ground biomass (AGB) was estimated non-destructively using equation29:
AGB = exp (-2.977+Ln (pD2H)) = 0.0509×pD2H |
where, AGB is aboveground biomass, D is diameter at breast height, H is total height, and p is wood density (wood specific gravity), p = 0.56, D2 = (DBH)2, and H = Height.
| • | Dry above ground biomass (DAGB)= 65% of AGB | |
| • | Below ground biomass (BGB) = 20% of AGB | |
| • | Dry below ground biomass (DBGB) = 65% of BGB | |
| • | Total biomass (TB) = DAGB+DBGB |
Total sequestered carbon (TSC):
| • | TSC/tree =50% of TB | |
| • | Sequestered carbon dioxide equivalent, SCO2E (kg) = TSC×3.67 | |
| • | SCO2E (Tonnes/Tree) = SCO2E (kg)×0.00130 |
RESULTS
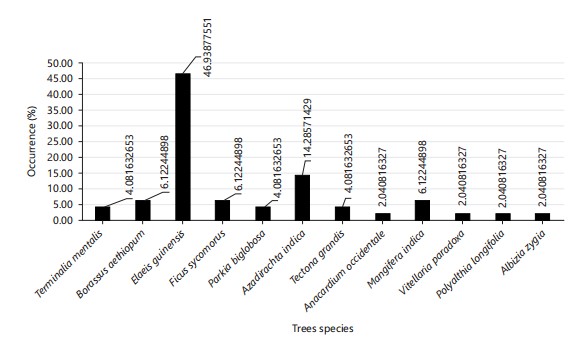
Tree species distribution: A total of 22 trees, belonging to 10 species, were recorded in the NASME golf course, and 28 trees, belonging to 6 species, were recorded in the New Bridge golf course. Making it a total of 50 trees, belonging to 12 species, were recorded from both sampled sites. Elaeis guineensis had the highest number of plants (5), representing 23.81% in NASME and 18 plants (64.29%) in New Bridge golf course (Fig. 1).
In general, the total number of Elaeis guineensis is 23 plants (46.94%) of the percentage occurrence from both sampled sites (Fig. 1).
Herbs species distribution: A total of 73 herbs and grasses, belonging to 46 species and 19 families, were sampled from NASME golf course (Table 1). Also, a total of 70 herbs and grasses, belonging to 53 species and 21 families, were sampled from the New Bridge Golf course (Table 2).
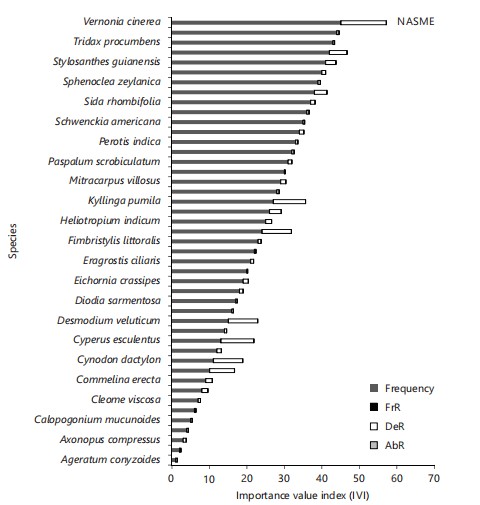
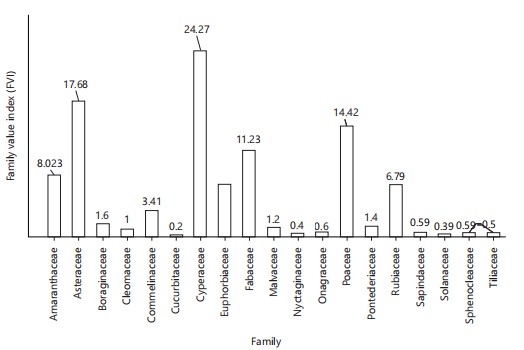
Vernonia cinerea had the highest relative frequency (0.122), relative density (12.25), and relative abundance (0.061), followed by Cyperus esculentus (0.089, 8.89, 0.44) and Kyllinga pumila (0.087, 8.70, 0.04), respectively. Furthermore, Vernonia cinerea had the highest IVI (12.44; Fig. 2). The FVI was highest in Cyperaceae (24.27) and least in Cucurbitaceae (0.2), Solanaceae, and Sapindaceae (0.39; Fig. 3), respectively.
|
|
|
| Table 1: | Herbs and grasses found in the NASME golf course | |||
| Sr/N | Scientific name | Family | Number of plot occurrence | Number of individuals per species |
| 1 | Ageratum conyzoides | Asteraceae | 1 | 2 |
| 2 | Antropon gayanus | Poaceae | 1 | 2 |
| 3 | Axonopus compressus | Poaceae | 1 | 4 |
| 4 | Boerhavia erecta | Nyctaginaceae | 1 | 2 |
| 5 | Calopogonium mucunoides | Fabaceae | 1 | 2 |
| 6 | Cleome rudidospermae | Cleomaceae | 1 | 2 |
| 7 | Cleome viscosa | Cleomaceae | 1 | 3 |
| 8 | Commelina benghalensis | Commelinaceae | 1 | 8 |
| 9 | Commelina erecta | Commelinaceae | 1 | 9 |
| 10 | Croton hirtus | Euphorbiaceae | 2 | 34 |
| 11 | Cynodon dactylon | Poaceae | 2 | 40 |
| 12 | Cyperus eragrostis | Cyperceae | 1 | 6 |
| 13 | Cyperus esculentus | Cyperaceae | 1 | 45 |
| 14 | Dactylocterium aegyptium | Poaceae | 1 | 3 |
| 15 | Desmodium veluticum | Fabaceae | 2 | 40 |
| 16 | Digitaria longiflora | Poaceae | 1 | 2 |
| 17 | Diodia sermentosa | Rubiaceae | 1 | 2 |
| 18 | Echinochloa colona | Poaceae | 1 | 5 |
| 19 | Eichornia crassipes | Pontederiaceae | 1 | 7 |
| 20 | Eleusine indica | Poaceae | 1 | 1 |
| 21 | Eragrostis ciliaris | Poaceae | 1 | 4 |
| 22 | Eragrotis tremula | Poaceae | 1 | 2 |
| 23 | Fimbristlylis littoralis | Cypraceae | 1 | 4 |
| 24 | Gomphrena celosoides | Amaranthaceae | 2 | 40 |
| 25 | Heliotropium indicum | Boraginaceae | 1 | 8 |
| 26 | Kyllinga bulbosa | Cypraceae | 1 | 16 |
| 27 | Kyllinga pumila | Cypraceae | 2 | 44 |
| 28 | Ludwingia hyssopifolia | Onagraceae | 1 | 3 |
| 29 | Mitracarpus villosus | Rubiaceae | 1 | 7 |
| 30 | Momordica charantia | Cucurbitaceae | 1 | 1 |
| 31 | Oldenlandia corymbosa | Rubiaceae | 1 | 8 |
| 32 | Paspalum scrobiculatum | Poaceae | 1 | 5 |
| 33 | Paullina pinnata | Sapindaceae | 1 | 3 |
| 34 | Perotis indica | Poaceae | 1 | 3 |
| 35 | Pycreus lanceolatus | Cypraceae | 1 | 6 |
| 36 | Schwenckia americana | Solanaceae | 1 | 2 |
| 37 | Setaria barbata | Poaceae | 1 | 3 |
| 38 | Sida rhombifolia | Malvaceae | 1 | 6 |
| 39 | Spermacoce ocymoides | Rubiaceae | 1 | 17 |
| 40 | Sphenoclea zeylanica | Sphenocleaceae | 1 | 3 |
| 41 | Sporobolus pyramidalis | Poaceae | 1 | 5 |
| 42 | Syllosanthes guianensis | Fabaceae | 1 | 14 |
| 43 | Synedrella nodiflora | Asteraceae | 2 | 24 |
| 44 | Tridax procumbens | Asteraceae | 1 | 2 |
| 45 | Triumfeta cordifolia | Tiliaceae | 1 | 3 |
| 46 | Vernonia cinerea | Asteraceae | 1 | 62 |
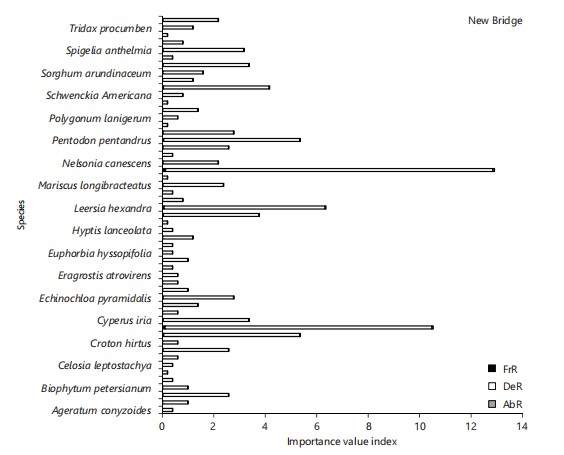
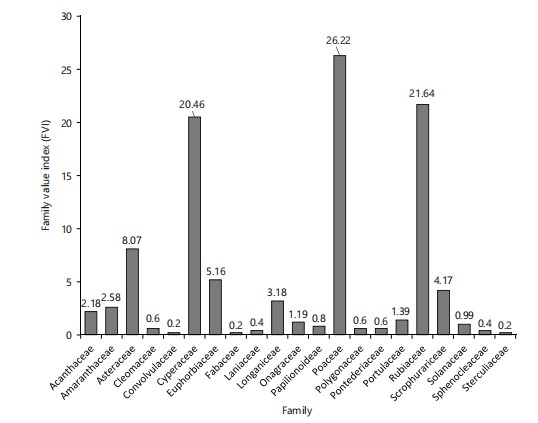
Mitracarpus villoscus had the highest relative frequency (0.127), relative density (12.72), and relative abundance (0.06), followed by Cyperus esculentus (0.10, 10.37, 0.05), respectively. Mitracarpus villoscus had the highest IVI (12.91; Fig. 4) while Poaceae had the highest FVI (26.22; Fig. 5). The most abundant species include: Mitracarpus villoscus, Cyperus esculentus, and Leersia hexandra, respectively.
Height and DBH classes
Distribution of trees: Height class 11-15 m had the highest frequency, representing 42.90% (Table 3). The DBH class (cm) 0-50 had the highest frequency, followed by class 51-100, with class 101-150 being the least (Table 4).
| Table 2: | Herbs and grasses found in the New Bridge golf course | |||
| Sr/N | Scientific name | Family | Number of plot occurrences | Number of individuals per species |
| 1 | Ageratum conyzoides | Asteraceae | 1 | 2 |
| 2 | Alternanthera sessilis | Amaranthaceae | 1 | 5 |
| 3 | Andropogon virginacus | Poaceae | 1 | 13 |
| 4 | Biophytum petersianum | Euphorbiaceae | 1 | 5 |
| 5 | Brachiaria lata | Poaceae | 1 | 2 |
| 6 | Calopognium mucunoides | Fabaceae | 1 | 1 |
| 7 | Celosia leptostachya | Amaranthaceae | 1 | 2 |
| 8 | Cleome vicosa | Cleomaceae | 2 | 3 |
| 9 | Conyzia sumatrensis | Asterceae | 1 | 13 |
| 10 | Croton hirtus | Euphorbiaceae | 1 | 3 |
| 11 | Cynodon dactylon | Poaceae | 1 | 27 |
| 12 | Cyperus esculentus | Cyperaceae | 2 | 53 |
| 13 | Cyperus iria | Cyperaceae | 1 | 17 |
| 14 | Desmodium scorpiurus | Papilionoideae | 1 | 3 |
| 15 | Digitaria longiflora | Poaceae | 1 | 7 |
| 16 | Echinochloa pyramidalis | Poaceae | 1 | 14 |
| 17 | Eclipta alba | Asteraceae | 1 | 5 |
| 18 | Eichorania crassipes | Pontederiaceae | 1 | 3 |
| 19 | Eragrostis atrovirens | Poaceae | 1 | 3 |
| 20 | Euphorbia heterophylla | Euphorbiaceae | 1 | 2 |
| 21 | Euphorbia hirta | Euphorbiaceae | 1 | 5 |
| 22 | Euphorbia hyssopifolia | Euphorbiaceae | 1 | 2 |
| 23 | Fimbristylis littoralis | Cyperaceae | 1 | 2 |
| 24 | Gomphena celosoides | Amaranthaceae | 1 | 6 |
| 25 | Hyptis lanceolata | Lamiaceae | 1 | 2 |
| 26 | Ipomoea aquatica | Convolvulaceae | 1 | 1 |
| 27 | Kyllinga pumila | Cypraceae | 1 | 19 |
| 28 | Leersia hexandra | Poaceae | 1 | 32 |
| 29 | Ludwingia abyssinica | Onagraceae | 2 | 4 |
| 30 | Ludwingia hyssopifolia | Onagraceae | 1 | 2 |
| 31 | Mariscus longibracteatus | cyperaceae | 2 | 12 |
| 32 | Melochia corchorifolia | Sterculiaceae | 1 | 1 |
| 33 | Mitracarpus villoscus | Rubiaceae | 1 | 65 |
| 34 | Nelsonia canenscens | Acanthaceae | 2 | 11 |
| 35 | Panicum maximum | Poaceae | 1 | 2 |
| 36 | Paspalum scrobiculatum | Poaceae | 1 | 13 |
| 37 | Pentodon pentandrus | Rubiaceae | 1 | 27 |
| 38 | Phyllantus amarus | Euphorbiaceae | 1 | 14 |
| 39 | Physalis angulata | Solanaceae | 1 | 1 |
| 40 | Polygonum lanigerum | Polygonaceae | 1 | 3 |
| 41 | Portulaca oleraceae | Portulaceae | 1 | 7 |
| 42 | Rottboellia cochinchinensis | Poaceae | 1 | 1 |
| 43 | Schwenkia americana | Solanaceae | 1 | 4 |
| 44 | Scorparia dulcis | Scrophulariceae | 2 | 21 |
| 45 | Setalia pumila | Poaceae | 1 | 6 |
| 46 | Sorghum arundinaceum | Poaceae | 1 | 8 |
| 47 | Spermacoce ocymoides | Rubiaceae | 1 | 17 |
| 48 | Sphenoclea zeylanica | Sphenocleaceae | 1 | 2 |
| 49 | Spigelia anthelma | Loganiceae | 2 | 16 |
| 50 | Sporobolus pyramidalis | Poaceae | 1 | 4 |
| 51 | Tephrosia bracteolate | Papilionoideae | 1 | 1 |
| 52 | Tridax procumben | Asteraceae | 2 | 6 |
| 53 | Vernonia cinerea | Asteraceae | 2 | 11 |
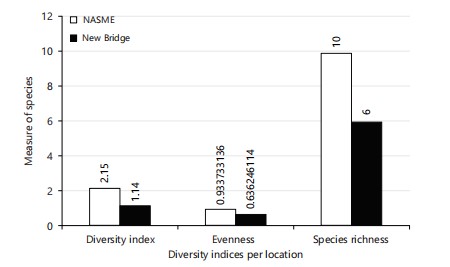
Diversity index (Shannon), evenness, and species richness: The Shannon-Weiner index of diversity was used to get the diversity index, and the results show that the diversity index of NASME is higher (2.15) than the diversity index of New Bridge (1.14). Also, in the species richness, NASME had the highest (10.00), than New Bridge (6.00), which proves that NASME has the highest measure of the number of different types of species. While in the species evenness, NASME also had the highest (0.64), meaning NASME has the highest measure of relative abundance of each species (Fig. 6).
|
| Table 3: | Height class distribution of species | |||
| Height class | Frequency (number) | Percentage (%) |
| 0-5 | 4 | 8.2 |
| 06-Oct | 20 | 40.8 |
| Nov-15 | 21 | 42.9 |
| 16-20 | 4 | 8.2 |
| Table 4: | DBH class distribution of species | |||
| DBH class (cm) | Frequency (number) | Percentage (%) |
| 0-50 | 31 | 63 |
| 51-100 | 16 | 33 |
| 101-150 | 2 | 4 |
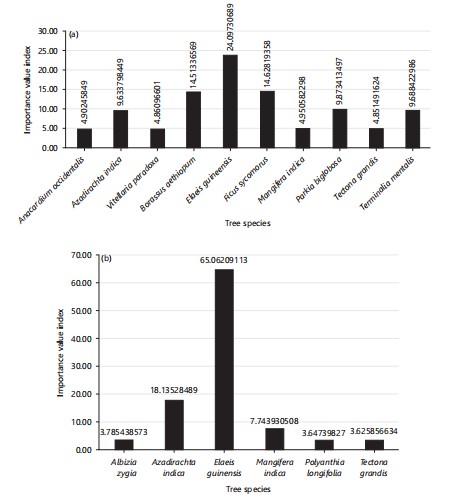
Species frequency, CD, BA, R. F, R. De, R. Do, and IVI in trees: Table 5 and 6 shows species DBH (cm), DBH2, tree height (m), canopy diameter, basal area, frequency, percentage of occurrence, relative frequency (RF), relative density (RDe), relative dominance (RDo), and importance value index (IVI) in NASME and New Bridge, respectively (Fig. 7a-b) shows the IVI of species in NASME and New Bridge, respectively.
In the NASME Golf course, Parkia biglobosa had the highest DBH (1.03) and the DBH2 (1.07), and had the highest tree height (17.55), with the highest canopy diameter (20.18) and highest basal area (0.84), and also the highest in relative dominance (0.25). While Elaeis guineensis had the highest frequency (5), representing 23.81% of the percentage occurrence, and the highest IVI (24.10) and highest CVI (23.86).
Azadirachta indica had the lowest DBH (0.25) and DBH2 (0.06), and had the lowest tree height (5.50). Furthermore, Azadirachta indica had the lowest basal area (0.05), and also the lowest relative dominance (0.01). Anacardium occidentalis, Bitellaria paradoxa, Mangifera indica, and Tectona grandis all had the lowest frequency (1), representing 4.76% of the percentage occurrence, relative frequency (0.05), and relative density (4.76), respectively (Table 5).
|
|
In the New Bridge golf course, Elaeis guinensis had the highest DBH (m) and DBH2 (0.4007 and 0.161), respectively. It had the highest tree height (11.38). Furthermore, Elaeis guineensis had the highest frequency (18), representing 64.29% percentage occurrence and the highest IVI and CVI (65.06, 64.42), respectively. While Albizia zygia, Polyanthia longifolia and Tectona grandis had the lowest frequency (1), representing 3.57% of the percentage occurrence with relative frequency (0.04) and relative density (3.57), respectively (Table 6).
| Table 5: | Species frequency, DBH, TH, CD, BA, percentage occurrence, RF, RDe, RDo, IVI, and CVI of trees in NASME Golf course | |||
| Sr/N | Tree | DBH (m) | DBH2 | Tree height (m) | Canopy diameter | Basal area | Frequency | Percentage occurrence | Rel. freq | Rel. den. | Rel. dom. | CVI | IVI |
| 1 | Anacardium occidentalis | 0.63 | 0.39 | 8.5 | 9.75 | 0.31 | 1 | 4.76 | 0.05 | 4.76 | 0.09 | 4.85 | 4.9 |
| 2 | Azadirachta indica | 0.25 | 0.06 | 5.5 | 5.95 | 0.05 | 2 | 9.52 | 0.1 | 9.52 | 0.01 | 9.53 | 9.63 |
| 3 | Bitellaria paradoxa | 0.47 | 0.22 | 10.5 | 8.5 | 0.17 | 1 | 4.76 | 0.05 | 4.76 | 0.05 | 4.81 | 4.86 |
| 4 | Borassus aethiopum | 0.6 | 0.36 | 12.13 | 9.88 | 0.28 | 3 | 14.29 | 0.14 | 14.29 | 0.08 | 14.37 | 14.51 |
| 5 | Elaeis guinensis | 0.46 | 0.21 | 11.28 | 5.28 | 0.16 | 5 | 23.81 | 0.24 | 23.81 | 0.05 | 23.86 | 24.1 |
| 6 | Ficus sycomorus | 0.92 | 0.84 | 12.03 | 13.47 | 0.66 | 3 | 14.29 | 0.14 | 14.29 | 0.2 | 14.49 | 14.63 |
| 7 | Mangifera indica | 0.77 | 0.59 | 10.1 | 10.75 | 0.47 | 1 | 4.76 | 0.05 | 4.76 | 0.14 | 4.9 | 4.95 |
| 8 | Parkia biglobosa | 1.03 | 1.07 | 17.55 | 20.18 | 0.84 | 2 | 9.52 | 0.1 | 9.52 | 0.25 | 9.77 | 9.87 |
| 9 | Tectona grandis | 0.42 | 0.18 | 11.1 | 8.75 | 0.14 | 1 | 4.76 | 0.05 | 4.76 | 0.04 | 4.8 | 4.85 |
| 10 | Terminalia mentalis | 0.54 | 0.29 | 15 | 17.5 | 0.23 | 2 | 9.52 | 0.1 | 9.52 | 0.07 | 9.59 | 9.69 |
| Table 6: | Gross composition of solvent extracted processed soyabean based diets | |||
| Sr/N | Tree | DBH (m) | DBH2 | Tree height (m) | Canopy diameter | Basal area | Frequency | Percentage occurrence | Rel. freq | Rel. Den. | Rel. Dom. | CVI | IVI |
| 1 | Albizia zygia | 0.463 | 0.214 | 10.5 | 6.05 | 0.17 | 1 | 3.57 | 0.04 | 3.57 | 0.18 | 3.75 | 3.79 |
| 2 | Azadirachta indica | 0.346 | 0.12 | 8.76 | 8.3 | 0.09 | 5 | 17.86 | 0.18 | 17.86 | 0.1 | 17.96 | 18.14 |
| 3 | Elaeis guineensis | 0.4007 | 0.161 | 11.38 | 8.21 | 0.13 | 18 | 64.29 | 0.64 | 64.29 | 0.13 | 64.42 | 65.06 |
| 4 | Mangifera indica | 0.798 | 0.637 | 11 | 9.68 | 0.5 | 2 | 7.14 | 0.07 | 7.14 | 0.53 | 7.67 | 7.74 |
| 5 | Polyanthia longifolia | 0.22 | 0.048 | 8 | 6.6 | 0.04 | 1 | 3.57 | 0.04 | 3.57 | 0.04 | 3.61 | 3.65 |
| 6 | Tectona grandis | 0.15 | 0.023 | 5.9 | 4.6 | 0.02 | 1 | 3.57 | 0.04 | 3.57 | 0.02 | 3.59 | 3.63 |
|
Plant biomass and total sequestered carbon of trees
Above and below ground biomass estimation: The result shows that Parkia biglobosa had the highest above-ground biomass (5348.40), dry above-ground biomass (3476.46), and Polyanthia longifolia and Tectona grandis had the lowest above-ground biomass (71.74).
Additionally, Parkia biglobosa had the highest below-ground biomass (1069.68), while Polyanthia longifolia and Tectona grandis had the lowest below-ground biomass (22.07), dry above-ground biomass (14.35) in both sampled sites (Table 7).
Furthermore, by location, Parkia biglobosa still had the highest above-ground biomass (5348.40), dry above-ground biomass (3476.46), and Azadirachta indica had the lowest above-ground biomass (97.0) in the NASME golf course. Mangifera indica had the highest above-ground biomass (1996.66), dry above-ground biomass (1297.83), and Tectona grandis had the lowest above-ground biomass (37.84) in the New Bridge golf course (Table 8).
| Table 7: | Gross composition of solvent extracted processed soyabean based diets | |||
| S/N | Tree | DBH (cm) | TH (m) | AGB | BGB (kg) (20% of AGB) | Total biomass (DAGB+DBGB) | SCO2E (kg) sequestered | SCO2E (kg) (Tones/Tree) |
| 1 | Albizia zygia | 46.3 | 10.5 | 641.59 | 128.32 | 500.44 | 918.31 | 0.92 |
| 2 | Anacardium occidentalis | 62.5 | 8.5 | 946.42 | 189.28 | 738.21 | 1354.61 | 1.35 |
| 3 | Azadirachta indica | 31.83 | 7.83 | 226.06 | 45.21 | 176.33 | 323.56 | 0.32 |
| 4 | Bitellaria paradoxa | 46.5 | 10.5 | 647.14 | 129.43 | 504.77 | 926.26 | 0.93 |
| 5 | Borassus aethiopum | 59.7 | 12.13 | 1232.64 | 246.53 | 961.46 | 1764.27 | 1.76 |
| 6 | Elaeis guinensis | 41.29 | 11.36 | 551.91 | 110.38 | 430.49 | 789.95 | 0.79 |
| 7 | Ficus sycomorus | 91.6 | 12.03 | 2877.95 | 575.59 | 2244.8 | 4119.2 | 4.12 |
| 8 | Mangifera indica | 78.87 | 10.7 | 1897.04 | 379.41 | 1479.69 | 2715.23 | 2.72 |
| 9 | Parkia biglobosa | 103.4 | 17.55 | 5348.4 | 1069.68 | 4171.75 | 7655.17 | 7.66 |
| 10 | Polyanthia longifolia | 22 | 8 | 110.37 | 22.07 | 86.09 | 157.97 | 0.16 |
| 11 | Tectona grandis | 22 | 8 | 110.37 | 22.07 | 86.09 | 157.97 | 0.16 |
| 12 | Terminalia mentalis | 54 | 15 | 1246.76 | 249.35 | 972.48 | 1784.49 | 1.78 |
| Table 8: | Gross composition of solvent extracted processed soyabean based diets | |||
| Location | Tree | DBH (cm) | DBH2 | TH | AGB | DAGB (kg) (65% of AGB |
BGB (kg) (20% of AGB) |
DBGB (kg) (65% of BGB) |
Total biomass (DAGB+DBGB) |
TSC/Tree (50% TB) |
| NASME | Anacardium occidentalis | 62.5 | 3906.25 | 8.5 | 946.42 | 615.17 | 189.2844 | 123.03 | 738.21 | 369.1 |
| NASME | Azadirachta indica | 24.9 | 620.01 | 5.5 | 97.2 | 63.18 | 19.44004 | 12.64 | 75.82 | 37.91 |
| NASME | Bitellaria paradoxa | 46.5 | 2162.25 | 10.5 | 647.14 | 420.64 | 129.4288 | 84.13 | 504.77 | 252.39 |
| NASME | Borassus aethiopum | 59.7 | 3564.09 | 12.13 | 1232.64 | 801.21 | 246.5271 | 160.24 | 961.46 | 480.73 |
| NASME | Elaeis guinensis | 45.7 | 2088.49 | 11.28 | 671.5 | 436.48 | 134.3004 | 87.3 | 523.77 | 261.89 |
| NASME | Ficus sycomorus | 91.6 | 8390.56 | 12.03 | 2877.95 | 1870.67 | 575.5893 | 374.13 | 2244.8 | 1122.4 |
| NASME | Mangifera indica | 77 | 5929 | 10.1 | 1706.9 | 1109.49 | 341.3804 | 221.9 | 1331.38 | 665.69 |
| NASME | Parkia biglobosa | 103.4 | 10691.56 | 17.55 | 5348.4 | 3476.46 | 1069.68 | 695.29 | 4171.75 | 2085.88 |
| NASME | Tectona grandis | 42 | 1764 | 11.1 | 558.12 | 362.78 | 111.6239 | 72.56 | 435.33 | 217.67 |
| NASME | Terminalia mentalis | 54 | 2916 | 15 | 1246.76 | 810.4 | 249.353 | 162.08 | 972.48 | 486.24 |
| New Bridge | Albizia zygia | 46.3 | 2143.69 | 10.5 | 641.59 | 417.03 | 128.3179 | 83.41 | 500.44 | 250.22 |
| New Bridge | Azadirachta indica | 34.6 | 1197.16 | 8.76 | 298.92 | 194.3 | 59.78498 | 38.86 | 233.16 | 116.58 |
| New Bridge | Elaeis guinensis | 40.07 | 1605.338 | 11.38 | 520.63 | 338.41 | 104.1261 | 67.68 | 406.09 | 203.05 |
| New Bridge | Mangifera indica | 79.8 | 6368.04 | 11 | 1996.66 | 1297.83 | 399.3321 | 259.57 | 1557.4 | 778.7 |
| New Bridge | Polyanthia longifolia | 22 | 484 | 8 | 110.37 | 71.74 | 22.0735 | 14.35 | 86.09 | 43.04 |
| New Bridge | Tectona grandis | 15 | 225 | 5.9 | 37.84 | 24.6 | 7.567812 | 4.92 | 29.51 | 14.76 |
|
|
Also, Parkia biglobosa had the highest below-ground biomass (1069.68), dry below-ground biomass (695.29), and Azadirachta indica had the lowest below-ground biomass (19.44004), dry below-ground biomass (12.64) in the NASME golf course. Mangifera indica had the highest below-ground biomass (399.3321), dry below-ground biomass (259.57), and Tectona grandis had the lowest below-ground biomass (7.567812), dry below-ground biomass (4.92) in the New Bridge golf course (Table 8).
Total plant biomass estimation: Parkia biglobosa had the highest total biomass (4171.75) while Polyanthia longifolia and Tectona grandis had the lowest (286.17). In both sampled sites (Table 7).
In the NASME golf course, Parkia biglobosa had the highest total biomass (4171.75), while in the New Bridge golf course, Mangifera indica had the highest total biomass (1557.40). Azadirachta indica had the lowest total biomass (75.82) in the NASME golf course, and Tectona grandis had the lowest total biomass (29.51) in the New Bridge golf course (Table 8).
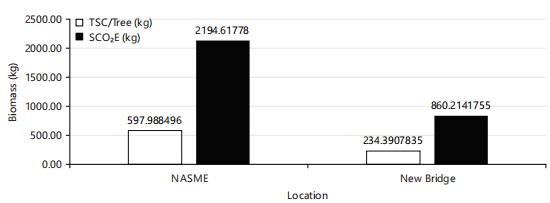
The TSC/tree (kg) in NASME (597.99) is higher than the TSC/tree (kg) in New Bridge (234.39). The SCO2E (kg) in NASME (2194.62) is higher than the New Bridge (860.21) (Fig. 9).
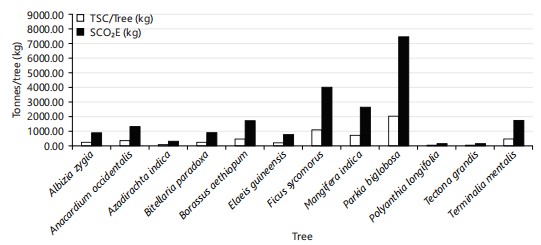
Sequestered carbon and CO2 equivalent estimation: Carbon storage varied with species (Table 7). Parkia biglobosa had the highest total sequestered carbon (2085.88), followed by Ficus sycomorus (1122.40). The least total sequestered carbon was in Polyanthia longifolia (43.04), followed by Azadirachta indica (88.16). furthermore, the sequestered carbon equivalent (SCO2E) was highest in Parkia biglobosa (7.66), followed by Ficus sycomorus (4.12), while Polyanthia longifolia and Tectona grandis had the least (0.16), followed by Azadirachta indica (0.32) (Table 5). Also, Fig. 8 shows how Parkia biglobosa had the highest SCO2E (kg) (7655.17) and TSC/Tree (kg) (2085.88).
|
|
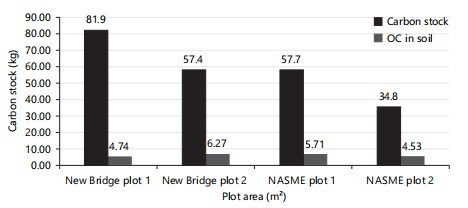
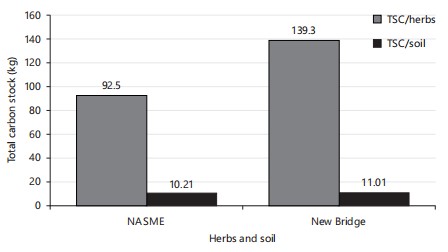
Total soil organic carbon stock and herbaceous carbon stock: In NASME, plot 1 had the highest soil organic carbon (5.71), then plot 2 (4.53; Fig. 10), while in New Bridge, plot 2 had the highest soil organic carbon (6.27; Fig. 10). Furthermore, in NASME, plot 1 had the highest herbaceous carbon stock (57.70), also in the new bridge plot 1 had the highest herbaceous carbon stock (81.90; Fig. 10). New Bridge had the highest soil organic carbon (11.01), then NASME (10.24), while in herbaceous carbon stock, New Bridge also had the highest (139.3) than NASME (92.5; Fig. 11).
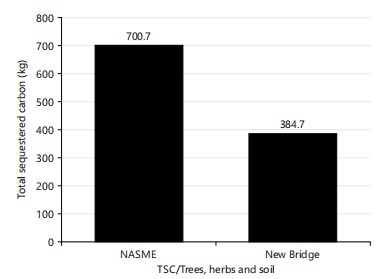
Total sequestered carbon of trees, herbs, and soil: The NASME had the highest total sequestered carbon (700.7) than the total number of sequestered carbons in the new bridge (384.7) (Fig. 12).
DISCUSSION
The diversity of species studied in two selected golf courses in Makurdi demonstrated the tolerance potential of trees and herbs to withstand anthropogenic influence (disturbance, displacement of habitat, and pollution). There are factors associated with the abundance of some species in both sampled sites. The presence or absence of some species in the golf course are influenced by several factors. This may be due to disturbances from abiotic sources such as climate and pollution (chemical contaminants), other factors include deforestation and introduction of exotic plants (such as grasses) and artificial vegetation to the site. Reported data in this work shows that Parkia biglobosa was the most distributed tree, a very important economic tree in Benue State. This aligns with the work by Howell et al.31, who reported that species frequency and dominance values are indicative of its economic importance.
|
Sustainable management of golf courses, such as reduction in chemical inputs, creating native habitat areas, and efficient use of water resources, can lead to the rehabilitation of degraded soils and enhance carbon stock in plants. This work confirms previous work by Balogh and Walker32, and Brown et al.33 that golf courses are potential biodiversity havens when managed effectively. Golf courses’ historical provides habitat for many species and a variety of phyto-remediating species, which occupy the area since they can absorb carbon, especially when natural habitats have been lost to development or urbanization.
Reports from investigations by Dobbs and Potter34 have suggested that an estimated 42% success in carbon storage could be possible only through reduction in deforestation activities, while 3% from forest management strategies, and the remaining 27% from afforestation measures. In contrast, poor forest management combined with increased soil degradation can impact the quantity of carbon in reservoirs and consequently reduce the sequestration potential of plants thus results These findings attribute the level of carbon sequestered by plants in study location to the management practices engaged by golf course owners35.
To mitigate the impact of climate change and reduce carbon storage, the golf landscape should therefore be sustainably managed through water conservation. This can be achieved by the introduction of smart irrigation methods (precision irrigation), selecting drought-resistant native species, and water cycling. Other strategies to mitigate climate change impact on golf courses include adoption of pest and waste management strategies, utilizing renewable sources of energy, introducing native plants into to landscape, workshops and training, as well as community engagements (Local Government and State Government).
The NASME golf course had the highest total carbon stock (700.7 kg) compared to the New Bridge golf course. One approach to maintaining and increasing carbon stock is through reforestation and afforestation projects (Colding, 2009). These projects involve planting native trees in areas that have been cleared of vegetation, which helps to sequester carbon and increase the carbon stock in the area. For example, a study conducted in Ethiopia demonstrated that reforestation efforts resulted in an increase in carbon stock by up to 44% in just in just five years36.
Another approach that can be employed is through the utilization of sustainable land management practices, such as conservation agriculture, agroforestry, and sustainable forest management. These practices not only help to sequester carbon but also promote biodiversity, improve soil health, and increase resilience to climate change. A study conducted in Ethiopia reported an increase of 41 to 60% soil C stock and 83 to 87% above-ground C stock following the conversion of degraded grazing lands to enclosure.
CONCLUSION
Results from this investigation have revealed carbon sequestration potentials and carbon stock variance in two golf courses studied, which are crucial in the management and conservation of plant resources, especially in anthropogenically influenced ecosystems, to mitigate greenhouse effects. The analysis of total sequestered carbon and sequestered carbon dioxide equivalence from study sites showcased the impact of plant diversity and C4 grasses in the sequestration of carbon. The NASME golf course was the most diverse location and sequestered the highest quantity of carbon. This is attributed to the presence of Poaceae and Cyperaceae species. Also, the total carbon stock in herbs and organic carbon content in soil were recorded as highest in the New Bridge golf course, and can be attributed to the relative density and relative frequency of trees present. Elaeis guineensis and Parkia biglobosa were the most important trees in all the study sites. Based on this finding, the planting of trees for increased carbon sequestration and propagation of C4 grasses in lawns and gardens for the storage of carbon in both soils and tissues of plants is recommended. Therefore, regular measurement and monitoring of carbon stocks over time should be considered by conservationists and ecologists as it is an effective indicator of whether progress is made in the reduction of greenhouse gases in an ecosystem. Protecting the planet entails collaborative efforts by researchers and community stakeholders to accurately assess and manage carbon stock in the environment, as a means of mitigating the impacts of climate change, thereby creating a more sustainable future for all.
SIGNIFICANCE STATEMENT
This study demonstrates the variation in carbon stock at selected sampled sites based on the degree of disturbance. Parkia biglobosa recorded the highest SCO2E (7655.17 kg), TSC/Tree (2085.88 kg), above-ground (5348.40 kg), and below-ground (3476.46 kg) biomass in both study locations. This investigation provides data on how much carbon is being stored in plants or soil and offers conservationists and ecologists informed strategies for monitoring carbon stocks in an ecosystem. Accurate assessments of carbon variance are an important instrument in the management and conservation of plant resources. The measurement and monitoring of carbon sequestration and carbon stocks over time is an effective indicator of whether progress is made in the reduction of greenhouse gases in an ecosystem.
ACKNOWLEDGMENT
The authors acknowledge administrative and technical support received from the Department of plant Science and Biotechnology, Joseph Sarwuan Tark University, Makurdi.
REFERENCES
- Xu, S., N. Eisenhauer, O. Ferlian, J. Zhang and G. Zhou et al., 2020. Species richness promotes ecosystem carbon storage: Evidence from biodiversity-ecosystem functioning experiments. Proc. R. Soc. B, 287.
- Eisenhauer, N., K. Mueller, A. Ebeling, G. Gleixner and Y. Huang et al., 2024. The multiple-mechanisms hypothesis of biodiversity-stability relationships. Basic Appl. Ecol., 79: 153-166.
- Jeldu, F.A., M. Tolera and T. Woldeamanuel, 2024. Predictive role of species diversity on aboveground carbon via functional diversity and dominance in the moist Afromontane forest: Implications for conservation policies. Int. J. For. Res., 2024.
- Mizanur Rahman, M., G.K. Kundu, M. Enamul Kabir, H. Ahmed and M. Xu, 2021. Assessing tree coverage and the direct and mediation effect of tree diversity on carbon storage through stand structure in homegardens of Southwestern Bangladesh. Forests, 12.
- Rapiya, M., W. Truter and A. Ramoelo, 2024. The integration of land restoration and biodiversity conservation practices in sustainable food systems of Africa: A systematic review. Sustainability, 16.
- Murphy, D.J., 2024. Carbon sequestration by tropical trees and crops: A case study of oil palm. Agriculture, 14.
- Halli, H.M., P. Govindasamy, M. Choudhary, R. Srinivasan and M. Prasad et al., 2022. Range grasses to improve soil properties, carbon sustainability, and fodder security in degraded lands of semi-arid regions. Sci. Total Environ., 851.
- Babaniyi, B.R., T.H. Olaide, I.B. Apara, O.K. Ajibola, D.O. Olaoluwa and A. Bisi-Omotosho, 2024. Soil Microbes and Climate Change Mitigation. In: Soil Microbiome in Green Technology Sustainability, Aransiola, S.A., H.I. Atta and N.R. Maddela (Eds.), Springer, Cham, Switzerland, ISBN: 978-3-031-71844-1, pp: 229-254.
- Dergham, S., A. Torkey, M. Bassam and M. Aboulnaga, 2025. Adaptive Approaches to Attain Net Zero Through Carbon Sequestration in Heritage Sites of Coastal Mediterranean Cities. In: Getting to Zero-Beyond Energy Transition Towards Carbon-Neutral Mediterranean Cities: Selected Papers from the World Renewable Energy Congress Med Green Forum 2024, Sayigh, A., A. Trombadore and G. Calcagno (Eds.), Springer, Cham, Switzerland, ISBN: 978-3-031-82323-7, pp: 563-575.
- Okoh, T., E.S. Okekporo, B.A. Atsuwe, G.T. Iorkya, I.O. Onen and W. Yar, 2023. Assessments of carbon credit potentials of Mangifera indica and Tectona grandis agroforestry plantations as viable options in climate change mitigation. Niger. J. Ecol., 19: 100-107.
- Sonawane, M.S., 2018. Types and methods of carbon sequestration: A review. Int. Arch. Appl. Sci. Technol., 9: 75-81.
- Singh, S.K., P.R. Thawale, J.K. Sharma, R.K. Gautam, G.P. Kundargi and A.A. Juwarkar, 2015. Carbon Sequestration in Terrestrial Ecosystems. In: Hydrogen Production and Remediation of Carbon and Pollutants, Lichtfouse, E., J. Schwarzbauer and D. Robert (Eds.), Springer, Cham, Switzerland, ISBN: 978-3-319-19375-5, pp: 99-131.
- Okoh, T., O.P. Okpara, I.E. Mbah and A.P. Ojochenemi, 2025. Net carbon sequestration and emission potentials in selected herbs at Joseph Sarwuan Tarka University Makurdi, Benue State, Nigeria. Int. J. Res. Publ. Rev., 6: 11814-11822.
- Makinde, E.O., A.A. Womiloju and M.O. Ogundeko, 2017. The geospatial modelling of carbon sequestration in Oluwa Forest, Ondo State, Nigeria. Eur. J. Remote Sens., 50: 397-413.
- Desie, E., K. Vancampenhout, L. van den Berg, B. Nyssen, M. Weijters, J. den Ouden and B. Muys, 2020. Litter share and clay content determine soil restoration effects of rich litter tree species in forests on acidified sandy soils. For. Ecol. Manage., 474.
- Thomas, O., A.C. Uzoma, O.E. Stephen, E.P. Ochuole and Z.S. Emmanuel, 2021. Diversity, importance value indices and carbon credit assessment of Parks in Joseph Sarwuan Tarka University, Makurdi, Nigeria. J. Earth Sci. Clim. Change, 12.
- Atsbha, T., A.B. Desta and T. Zewdu, 2019. Carbon sequestration potential of natural vegetation under grazing influence in Southern Tigray, Ethiopia: Implication for climate change mitigation. Heliyon, 5.
- Priscilla, O.O. and P.N. Zegenyo, 2025. Morphological characterization of selected tropical trees in Makurdi. Inwascon Technol. Mag., 7: 63-68.
- Henry, M., N. Picard, C. Trotta, R. Manlay, R. Valentini, M. Bernoux and S.L. Andre, 2011. Estimating tree biomass of Sub-Saharan African forests: A review of available allometric equations. Silva Fennica, 45: 477-569.
- Okpara, O.P. and O.I. Okogwu, 2024. Plant diversity at selected dumpsites in Abakaliki: Exploring species tolerance and carbon storage functions. J. Appl. Life Sci. Environ., 57: 673-700.
- Heikkinen, J., R. Keskinen, K. Regina, H. Honkanen and V. Nuutinen, 2021. Estimation of carbon stocks in boreal cropland soils-methodological considerations. Eur. J. Soil Sci., 72: 934-945.
- Shannon, C.E., 1948. A mathematical theory of communication. Bell Syst. Tech. J., 27: 379-423.
- Terefe, H., M. Argaw, L. Tamene and K. Mekonnen, 2020. Sustainable land management interventions lead to carbon sequestration in plant biomass and soil in a mixed crop-livestock system: The case of Geda watershed, central highlands of Ethiopia. Ecol. Processes, 9.
- Pielou, E.C., 1966. Shannon's formula as a measure of specific diversity: Its use and misuse. Am. Nat., 100: 463-465.
- Goswami, M., P. Bhattacharyya, I. Mukherjee and P. Tribedi, 2017. Functional diversity: An important measure of ecosystem functioning. Adv. Microbiol., 7: 82-93.
- Li, J., Y. Luo, X. Song, D. Jiang and Q. He et al., 2023. Effects of the dominate plant families on elevation gradient pattern of community structure in a subtropical forest. Forests, 14.
- Ismail, M.H., P.H. Zaki, M.F.A. Fuad and N.J.N. Jemali, 2017. Analysis of importance value index of unlogged and logged peat swamp forest in Nenasi Forest Reserve, Peninsular Malaysia. Bonorowo Wetlands, 7: 74-78.
- Iizuka, K., T. Yonehara, M. Itoh and Y. Kosugi, 2018. Estimating tree height and Diameter at Breast Height (DBH) from digital surface models and orthophotos obtained with an unmanned aerial system for a Japanese cypress (Chamaecyparis obtusa) forest. Remote Sens., 10.
- Bonham, C.D., 1989. Measurements of Terrestrial Vegetation. Jhon Wiley and Sons, New York, USA, ISBN: 978-0-471-04880-0, Pages: 352.
- He, G., Z. Zhang, Q. Zhu, W. Wang, W. Peng and Y. Cai, 2022. Estimating carbon sequestration potential of forest and its influencing factors at fine spatial-scales: A case study of Lushan City in Southern China. Int. J. Environ. Res. Public Health, 19.
- Howell, J.P., J. Moore, L.A. Petersen and P. Crumrine, 2024. Biodiversity on golf courses: Role of sustainability certifications. Int. J. Sport Manage., 25: 345-378.
- Balogh, J.C. and W.J. Walker, 1992. Golf Course Management and Construction: Environmental Issues. 1st Edn., CRC Press, Boca Raton, Florida, ISBN: 9781003070092, Pages: 966.
- Brown, S., A. Coday and I. Frame, 2017. Managing golf greens: Aligning golf green quality with resource inputs. Urban For. Urban Greening, 26: 198-202.
- Dobbs, E.K. and D.A. Potter, 2016. Naturalized habitat on golf courses: Source or sink for natural enemies and conservation biological control? Urban Ecosyst., 19: 899-914.
- Dibaba, A., T. Soromessa and B. Workineh, 2019. Carbon stock of the various carbon pools in Gerba-Dima moist Afromontane forest, South-Western Ethiopia. Carbon Balance Manage., 14.
- Colding, J. and C. Folke, 2009. The role of golf courses in biodiversity conservation and ecosystem management. Ecosystems, 12: 191-206.
How to Cite this paper?
APA-7 Style
Okoh,
T., Okpara,
O.P., Noah,
D. (2025). Species Diversity and Carbon Accumulation of Two Golf Courses in Makurdi, Benue State. Trends in Environmental Sciences, 1(3), 327-345. https://doi.org/10.21124/tes.2025.327.345
ACS Style
Okoh,
T.; Okpara,
O.P.; Noah,
D. Species Diversity and Carbon Accumulation of Two Golf Courses in Makurdi, Benue State. Trends Env. Sci 2025, 1, 327-345. https://doi.org/10.21124/tes.2025.327.345
AMA Style
Okoh
T, Okpara
OP, Noah
D. Species Diversity and Carbon Accumulation of Two Golf Courses in Makurdi, Benue State. Trends in Environmental Sciences. 2025; 1(3): 327-345. https://doi.org/10.21124/tes.2025.327.345
Chicago/Turabian Style
Okoh, Thomas, Onyinyechi Priscilla Okpara, and Daniel Noah.
2025. "Species Diversity and Carbon Accumulation of Two Golf Courses in Makurdi, Benue State" Trends in Environmental Sciences 1, no. 3: 327-345. https://doi.org/10.21124/tes.2025.327.345

This work is licensed under a Creative Commons Attribution 4.0 International License.